Reports as Data Feeds
Reporting Services SQL Server 2008 R2 features reports as Atom data feeds. This is accomplished with a new Atom Data Feed extension, as shown on this screenshot.
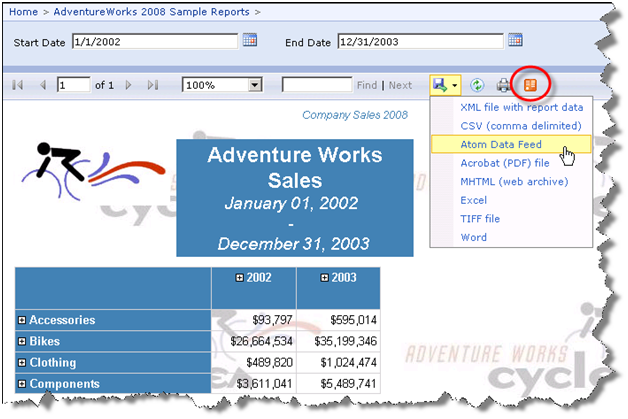
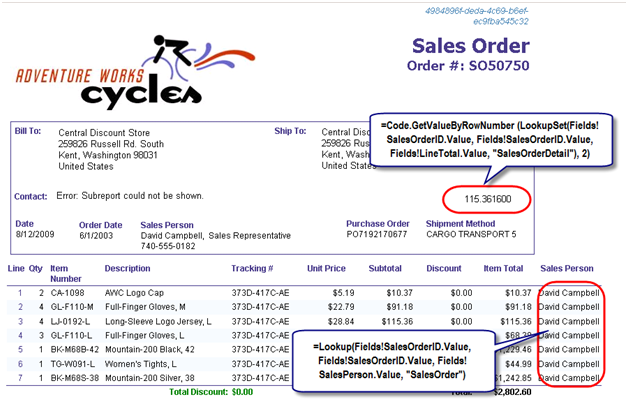
This extension produces an atom service document (an *.atomsvc file). It lists at least one data feed for each data region in a report. In fact, some regions, such as tablix with column groups (cross-tab report layout) may generate multiple feeds.
At this point, you probably imagine subscribing to reports and receiving feeds in Outlook when report data is changed. Unfortunately, you won’t get very far doing so. As it turns out, atom data feeds are different from Atom feeds that most applications, such as IE and Outlooks understand directly. So even if you extract the Url out of the service document and display the .atom rendering of a report in IE, the browser won’t show useful information because it doesn’t understand that the data rows in the data feed are the important part.
So, how are report data feeds useful then? At this point, the design goal for reports as data feeds was to support Gemini – the new Excel 2010 extension that lets end users build in-memory cubes. Gemini can acquire data from variety of data sources, including data feeds and SSRS reports. Here is what it takes to subscribe to a report feed.
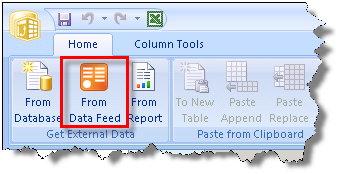
- In the Gemini add-in, click the From Data Feed button.
-
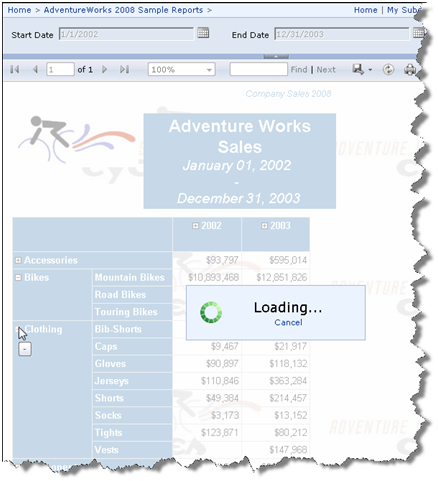
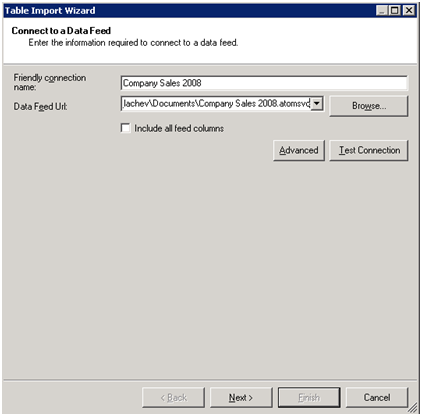
On the Connect to Data Feed step of the Table Import Wizard, browse to the data feed file you exported from the report. In this case, I am pointing to the atomsvc file exported from Company Sales 2008 report. On this step, you can set up advanced options, such as timeout, authentication, etc, and test the feed.

-
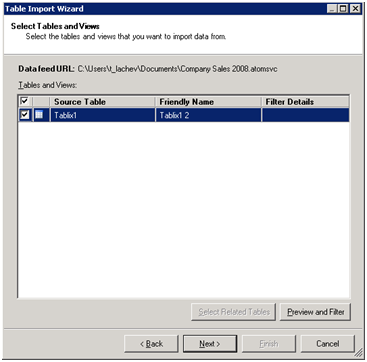
On the Select Tables and Views step, select the regions on the report whose feeds you want to subscribe to. Since Company Sales 2008 has only one region, only one data feed is exposed. You can click the Preview button to preview the feed data. In the preview window, you can select which columns to import and set up a row filter (doesn’t seem to be working in the August CTP).Reporting Services, Analysis Services, Microsoft Office, SQL Server 2008 R2
- On the Import Summary step, preview the feed options and click Finish to import the data.
This imports the feed data into the Excel spreadsheet. From there, you can use Gemini to build the in-memory model and analyze the report data.