How to Get Extended Properties with SSAS OLE DB Provider

Many report developers find the SSAS data provider too restrictive for authoring reports from UDM. Instead, they replace it with the native Microsoft OLE DB Provider for Analysis Services 9.0 which gives them maximum flexibility at the expense of convenience (the query has to be hand-generated, parameters are not supported, extended properties are not available, etc).

By default, the OLE DB provider doesn’t return the extended cell properties, such as format and color settings. Thanks to Robert Bruckner from the SSRS team, here is a precious tip to get the extended properties:

  1. Append Extended Properties=”ReturnCellProperties=true” to the OLE DB connection string of your data source, e.g.:
    Provider=MSOLAP.3;Data Source=localhost;Initial Catalog=”Adventure Works DW”;Extended Properties=”ReturnCellProperties=true”
  2. Request the cell properties in your MDX query as the SSAS provider does, e.g.:

SELECT NON EMPTY { [Measures].[Internet Sales Amount], … } ON COLUMNS,
NON EMPTY { [Sales Territory].[Sales Territory Group].[Sales Territory Group].ALLMEMBERS , …. }
FROM [Adventure Works]
CELL PROPERTIES VALUE, BACK_COLOR, FORE_COLOR, FORMATTED_VALUE, FORMAT_STRING, FONT_NAME, FONT_SIZE, FONT_FLAGS

  1. Execute the query. The OLE DB Provider returns the extended properties as fields in the dataset.

You will notice that the OLE DB provider returns the cell colors as numeric values. To convert the SSAS numeric colors to RGB colors for use on your report, you can use this helper function in your report.

int intValue = ConvertToInt32(value, out isValid);

if (isValid) {

return String.Format(“#{0:x2}{1:x2}{2:x2}”,

(intValue & 0x000000ff),

(intValue >> 8) & 0x000000ff,

(intValue >> 16) & 0x000000ff);

}

SQL Server Katmai Reporting Services Forum

In case you’ve missed it, the SSRS team has started a SQL Server Katmai Reporting Services forum and eagerly awaits your feedback.

Tablix – The Crown Jewel

One of most important enhancements coming up in SQL Server 2008 Reporting Services is the new tablix region. In fact, I dare to predict that many folks will upgrade to SSRS 2008 just to get Tablix. What’s tablix anyway?

Tablix = Table + Matrix

So, tablix combines the flexibility of the table region and the crosstab reporting features of the matrix region. Actually, a tablix is table, matrix, and list all in one but I guess the SSRS team decided to keep the name short. Don’t be fooled by the old toolbar buttons because they just provide entry points to the tablix region. If you click the Matrix button, you will get a tablix region preconfigured for crosstab reporting, when you click the Table button you get a table report, and List button will give you a free-form Tablix. So, this is simple. In SSRS 2008, tablix powers all reports.

Why is Tablix so cool? Because it lifts many of the matrix limitations and add features not possible before. Take for example the following report that demonstrates a couple of the new Tablix features.

081307_0232_TablixTheCr1

First, Tablix lets you have stepped columns with crosstab reports. For example, Product Category and Product Subcategory share the same column. This may not sound very exciting but it wasn’t that easy to implement with the old matrix region.

Second, Tablix supports side-by-side crosstab sections. For example, the report has by year and by region sections side by side. This wasn’t possible with Matrix.

Finally, the snapshot doesn’t show this but you have independent group aggregates with crosstab reports. This means that moving to SSRS 2008 you can forget about the InScope() function and all limitations associated with it and matrix-based reports. These limitations made me abandon the matrix region in one of my projects and replace it with programmatically-generated “pseudo” crosstab reports that used the table region.

To take Tablix for a spin, use the standalone Report Designer. Or, open an existing SSRS report in the standalone Report Designer. As mentioned in my previous post, the VS.NET Report Designer doesn’t support Tablix in CTP4.

Matrix is dead, long live Tablix!

The New Kid on the Block (aka Stand-alone Report Designer)

The need for a stand-alone Report Designer is real. True, developers, including myself, enjoyed the VS.NET Report Designer. But novice users were overwhelmed with the complexity of the VS.NET IDE environment. In addition, not all IT shops rejoiced over the idea to install VS.NET or BIDS just to author reports. Enters the SSRS 2008 stand-alone report designer.

080707_1113_TheNewKidon1

As its name suggests, you run this designer completely outside VS.NET. In fact, in CTP4, VS.NET has not been yet integrated with the new designer (it still uses the RS 2005 designer). Therefore, to get the new RDL enhancements in CTP 4, such as tablix, you need to use the stand-alone report designer.

Note that stand-alone doesn’t mean embeddable. While a future release make this possible, it is unlikely that you will be able to embed the SSRS 2008 designer in custom .NET application.

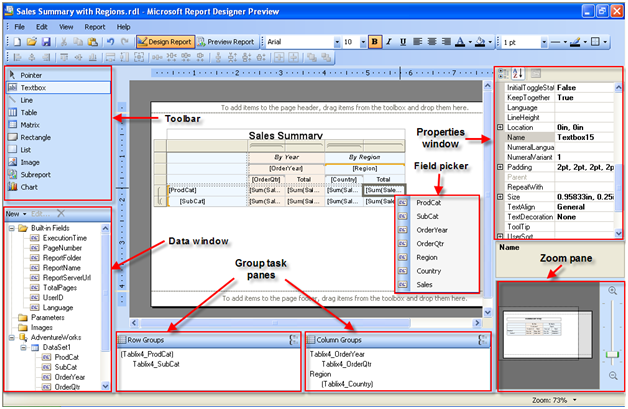
You launch the stand-alone report designer from the Report Designer Preview link in the Reporting Services program group. As you would immediately see, its UI resembles the Report Builder UI. There are a few welcome enhancements. First, there is a new Data Window which shows the Build-in Fields, Parameters, Images, and Datasets all in one place. Next, the Group Task Panes shows conveniently the row and column groups and minimizes the steps required to set up a new group. With SSRS 2005, you had to create a new row in the table region and configure it using the Group properties dialog box. Moving forward, you can just drag a dataset field below a given group in the pane to create a new subgroup.

Clicking inside a textbox shows a Field Picker icon. When you click on it, you will see a dropdown of the dataset fields and conveniently pick the field instead of dragging it from the dataset fields to the textbox. While we are on this subject, you will notice that for the sake of brevity the Report Designer replaces the field expressions with tokens (enclosed with square brackets), such as [Sum(Sales)] instead of =Sum(Fields!Sales.Value). Clicking inside the textbox gives you access to the actual expression.

There is also a new Zoom pane which lets you zoom the report in and out. As you would expect from an early build, many features are not hooked up yet. For example, report preview requires uploading the report to the server.

Oh, yes… the thing in the middle is the new Tablix region but this is a topic for another post.

The Perfect Host

This is my first blog about SSRS 2008. The July CTP (CTP4) of SQL Server 2008 (aka Katmai) includes the new hosting model of Reporting Services. Gone is the dependency to IIS and all the management headaches associated with it. Instead, the SSRS Windows service pulls a nice trick by hosting the http.sys kernel-mode device driver which listens for HTTP requests. Behind the scenes, the SSRS Windows service hosts application domains for the Report Manager and Report Server and forwards the incoming requests to them.

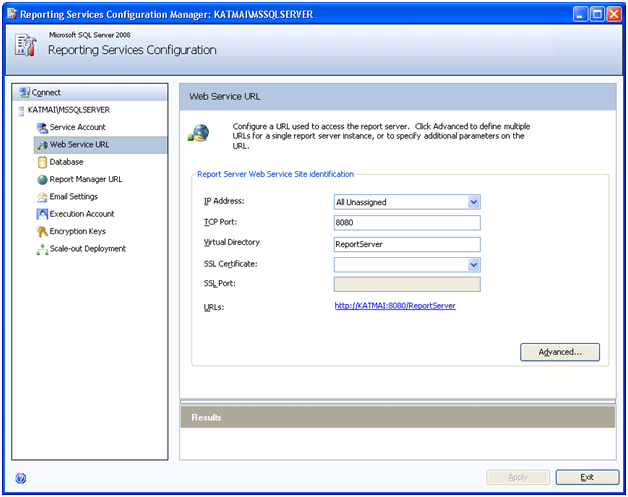
You reserve URL addresses for Report Manager and Report Server by using the Reporting Services Configuration utility. If you have ever set up a web site in IIS, you know everything you need to reserve an URL address. The URL address consists of IP address, TCP port, and vroot. You can specify any unreserved port (in Vista and Windows Server 2003+ you can have SSRS and another application listen on the same port, e.g; IIS and Report Server both listening on port 80). For example, if you reserve port 8080 and accept the defaults, the report server URL address will be http://<servername>:8080/ReportServer. You can optionally use the Advanced tab to specify additional settings, such as host headers. When the SSRS Windows service starts it registers the URL addresses with http.sys. Http.sys listens for http requests and forwards them accordingly.

080407_1538_ThePerfectH1

While we are still on the Reporting Services Configuration topic, here is a nice tip. CTP4 doesn’t officially support upgrading from SSRS 2005. However, you may need to test old reports with SSRS 2008. You can upgrade an old catalog by using the Database tab and pointing to a SQL Server 2005 instance that hosts the SSRS 2005 catalog. The Reporting Services Configuration utility will upgrade the catalog in place. Later, you can back up and restore the catalog on the SQL Server 2008 instance if you need to remove the dependency on the SQL Server 2005 instance.

Scale-Out Querying with Analysis Services Article

I’ve come across a good best practices article about scaling out SSAS by Denny Lee and Nicholas Dritsas. It describes how to set up a load-balanced scalable querying environment for Microsoft SQL Server 2005 Analysis Services so that you can handle a large number of concurrent queries to your Analysis Services servers.

July CTP of SQL Server 2008 Is Out

July CTP of SQL Server 2008 (Katmai) is out. On the BI side of things:

  1. New SSRS Report Engine
    “Improvements represent the two major infrastructure changes for Reporting Services. Reporting Services enhances the processing engine and rendering extensions to enable new functionality, such as Tablix support, and scalability as well as remove the dependency on IIS. Additionally, new report designer and configuration tool are provided that improve usability and workflow for RS customers.”
  2. Analysis Services Time Series
    This improvement adds a new time series forecasting algorithm (ARIMA: Auto Regressive Integrated Moving Average) to the data mining algorithm suite that provides more stable long term predictions.

Empty Affairs

If you have a cube with large dimensions you may have come across the following error:

The expression contains a function that cannot operate on a set with more than 4,294,967,296 tuples.

The culprit is the NON EMPY (or NonEmpty), as mentioned in the Chris Webb’s blog and Mosha Passumansky’s blog. It turns out that NonEmpty simply gives up when the number of tupples in the cross-join members exceeds 4GB. The problem is all Microsoft SSAS clients (Excel, Reporting Services, Report Builder, etc.) are blissfully unaware of the trap to come and would happily cross-join dimension members as you add more dimensions to the report. Take for example the following (simplified) query produced by the Report Designer when the report shows the customer name and its accounts:

SELECT NON EMPTY { [Measures].[Sales] } ON COLUMNS,
NONEMPTY { ([Customer].[Customer].[Customer].ALLMEMBERS *
[Account].[Customer Account Number].[Customer Account Number].ALLMEMBERS)} ON ROWS
FROM <some cube>
WHERE ([Date].[Date].&[20070712])

In my case, the server returned the 4GB error with about 150,000 customers and 200,000 customer accounts. I can think of two approaches to avoid this error:

  1. Use Autoexists – Consider placing the frequently-queried large attribute hierarchies in the same dimension. Not only this may avoid the error but also it may give you better performance since the server knows how to cross-join attribute hierarchies within the same dimension efficiently. Let’s say you can add the Customer attribute to the Account dimension so it exists both in the Customer and Account dimensions. This query executes successfully:

    SELECT NON EMPTY { [Measures].[Sales] } ON COLUMNS,
    NONEMPTY { ([Account].[Customer].[Customer].ALLMEMBERS *
    [Account].[Customer Account Number].[Customer Account Number].ALLMEMBERS)} ON ROWS
    FROM <some cube>
    WHERE ([Date].[Date].&[20070712])

  2. Reduce large sets with Exists() before NonEmpty()

    SELECT NON EMPTY { [Measures].[Sales] } ON COLUMNS,
    NONEMPTY { ([Customer].[Customer].[Customer].ALLMEMBERS *
    Exists([Account].[Customer Account Number].[Customer Account Number].ALLMEMBERS, [Date][Date].CurrentMembers, “<Measure Group Name>”)} ON ROWS
    FROM <some cube>
    WHERE ([Date].[Date].&[20070712])

In this case, the Exists function returns only the customer accounts that have data in the measure group for the date requested. The net result is that you pass a much smaller set of accounts to the NonEmpty function.

SQL Server 2008 (Katmai) to Launch February 28th 2008

From the latest MS press release “In anticipation for the most significant Microsoft enterprise event in the next year, Turner announced that Windows Server 2008, Visual Studio 2008 and Microsoft SQL Server 2008 will launch together at an event in Los Angeles on Feb. 27, 2008, kicking off hundreds of launch events around the world.”

Whoa, I didn’t expect Katmai so soon. Well, Euan Garden is telling us that a marketing launch doesn’t mean all that much after all [;)]. It will probably be a few more months before Katmai RTMs.

SSRS Setup Woes

I was setting up Reporting Services 2005 today on a clean Windows XP machine and I came across the infamous error:

The report server has encountered a configuration error. See the report server log files for more information. (rsServerConfigurationError). Access to the path ‘c:\Program Files\Microsoft SQL Server\MSSQL.2\Reporting Services\ReportServer\RSReportServer.config’ is denied.

Here is how I fixed this horrible problem. First, I open the Computer Manager and verified that the following two groups exist: SQLServer2005ReportingServicesWebServiceUser$<machinename>$MSSQLSERVER and SQLServer2005ReportServerUser$<machinename>$MSSQLSERVER.

Next, I used the Windows Explorer to verify that these groups have read ACL permissions to the Report Server folder (C:\Program Files\Microsoft SQL Server\MSSQL.3\Reporting Services\ReportServer) by right-clicking on the this folder and checking the Security tab. Finally, I verified that the following users have been assigned to these groups.

  • SQLServer2005ReportingServicesWebServiceUser$<machinename>$MSSQLSERVER should have the ASP.NET account assigned to it. In Windows XP, the default ASPNET account is <MachineName>\ASPNET. In Windows Server 2003 and Vista, this should be the built-in NT AUTHORITY\Network Service account.
  • The SQLServer2005ReportServerUser$<machinename>$MSSQLSERVER should have the account the SSRS Windows Service is running under, e.g.; NT Authority\SYSTEM, if it is running under local system.

In my case, the issue was caused by the fact that for some obscure reason, the SQL Server setup program had added <domain>\ASPNET to SQLServer2005ReportingServicesWebServiceUser$<machinename>$MSSQLSERVER instead of the local ASPNET account. So, I removed this account and added machinename\ASPNET. This took care of rsServerConfigurationError.

Since I wanted to use my old ReportServer database I followed the steps in this KB article to restore it over the existing catalog database. But then when I browse to localhost/reportserver I had another error that SSRS cannot connect to the ReportServer database because login failed for the ASPNET account. So, I tried the Reporting Services Configuration utility and hit the Apply button on the Database tab but I got an error status message that the ASPNET account already exists in the ReportServer database. To solve this error, I used SQL Server Management Studio to drop the existing ASPNET logins and associated schemas from the ReportServer and ReportServerTemp databases and hit the Apply button on the Database tab in the Reporting Services Configuration utility again.