Prologika Power BI Showcase

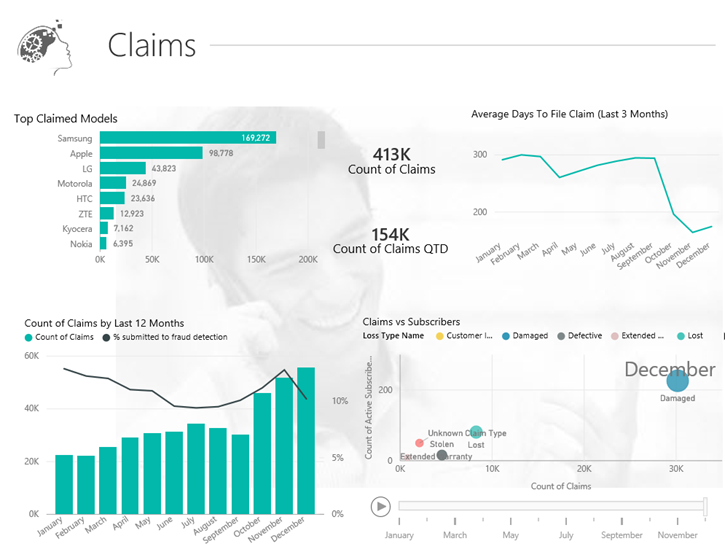
Microsoft launched a Power BI Partner Showcase section to help you “find the right solution for your organization” from certified partners like Prologika. I’m excited to announce the first Prologika Power BI Showcase! It’s based on the work we did for an insurance company. This solution transformed the organization’s data into a key strategic business asset, empowering employees like never before. It currently includes over 300 performance measures that can be analyzed across various dimensions, enabling business to collaborate and share insights with rich data storytelling. The solution delivers a “single version of truth” approach for reporting, and empowers business users to build customized reports and analyses using various tools.

“We are extremely excited for the actionable intelligence and foresight this new tool will bring to our organization”
Director Supply Chain Analytics

Visit the solution page to learn more about how we did it, watch a short video, and even try the interactive reports! Have questions? Contact me to today to find how Power BI can change your business!
The Best Self-Service BI Tools of 2015

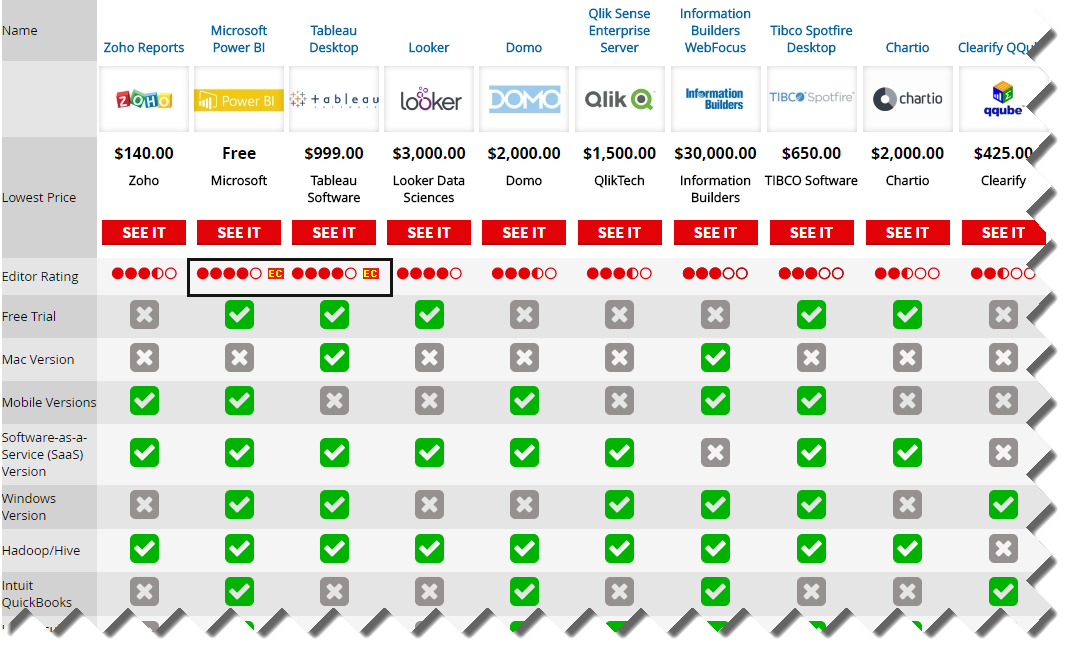
I came across this interesting PC Magazine article that just came up to compare 10 popular self-service BI tools. And the winner is? Power BI, of course, rubbing shoulders with Tableau for the Editor Choice award! The author, David Strom, did a great job reviewing the tools (this is not a trivial undertaking) but a few Power BI conclusions deserve clarifications:

  • Cons: “Cloud version has a subset of features found in Windows version” – The cloud version is meant to be simple on purpose so that business users can start analyzing data without any modeling.
  • Sharing: “Microsoft relies on the shared Microsoft OneDrive at Microsoft cloud service (or what it calls a “content pack”) to personalize and share your dashboard and reports via unique URLs” Power BI doesn’t rely on OneDrive for collaboration. Instead it supports three ways to share content: simple dashboard sharing, workspaces, and content packs.
  • Custom visuals: “You can get quickly up to speed by searching through an online visualizations gallery to find the particular presentation template you want to use to show your data. This is the reverse of what many BI tools such as Tableau Desktop ($999.00) at Tableau Software and Domo ($2,000.00) at Domo have you do, and it takes a bit of getting used to.” Not sure what this refers to. There are built-in visualizations and starting up with them is no different than using other tools. But we have also custom visuals that no other vendor has.
  • Custom visuals:” A new section called “Developer Tools” lets you build custom visualizations using a Visual Basic-like scripting language that is documented in a GitHub project. While it is still in beta, it could be a very powerful way to add your own custom look to your dashboards” The Dev Tools for implementing custom visuals outside Visual Studio is in preview but the actual visualization framework is not. And developers use TypeScript (superset of JavaScript) and not Visual Basic.

Speaking about reviews, here are some important Power BI characteristics that make it stand above the rest of the pack:

  1. Data engine and DAX – no other tool can come close to the Power BI in-memory engine that allows data analysts to build data models that are on a par with professional models.
  2. Hybrid architecture that allows to connect your visualizations to on premise data sources.
  3. Self-service ETL with Power Query – as far as I know, no other tool has such capabilities.
  4. Open architecture that allows developers to extend the Power BI capabilities
  5. Great value proposition that follows the freemium model – Power BI Desktop is free, Power BI Mobile is free, Power BI service is mostly free.

pcmag

The One and Only Power BI Book

To me, Power BI is the most exciting milestone in the Microsoft BI journey since circa 2005, when Microsoft got serious about BI. Power BI changes the way you gain insights from data; it brings you a cloud-hosted, business intelligence and analytics platform that democratizes and opens BI to everyone.

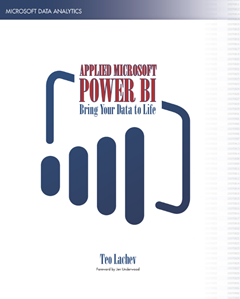
I’m happy to announce my latest (7th) book – Applied Microsoft Power BI. Currently, the one and only book on Power BI. Some people discouraged me to write this one. After all, trying to cover a product that changes every week is like trying to hit a moving target. However, I believe that the product’s fundamentals won’t change and once you grasp them, you can easily add on knowledge as Power BI evolves over time. Because I had to draw a line somewhere, “Applied Microsoft Power BI” covers all features that were announced at the PASS Summit 2015 and that were released by December 2015.

The book has four parts for each of the four user types: information worker, data analyst, pro, and developer. Information workers will learn how to connect to popular cloud services to derive instant insights, create interactive reports and dashboards, and view them in the browser and on the go. Data analysts will discover how to integrate and transform data from virtually everywhere, and then implement sophisticated self-service models. The book teaches BI and IT pros how to establish a trustworthy environment that promotes collaboration and how to implement Power BI-centric solutions for descriptive, real-time, and predictive analytics. Developers will find how to integrate custom applications with Power BI, embed reports, and implement custom visuals to present effectively any data.

The book is making its way slowly through the retail channels but it should be available on Amazon (in both paper and Kindle formats) and with other retailers before the holidays. I’ll drop a note and update the book page once the book is available for purchase. Meanwhile, visit the book page for more information about the book, source code, and a sample chapter (Chapter 1 “Introduction to Power BI”).

I predict that 2016 will be the year of Power BI and I hope that this book will help you bring your data to life!