-
Drilling Through in Power BI
May 1, 2016 / No Comments »
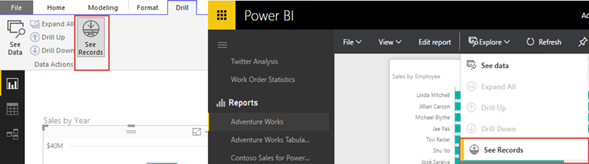
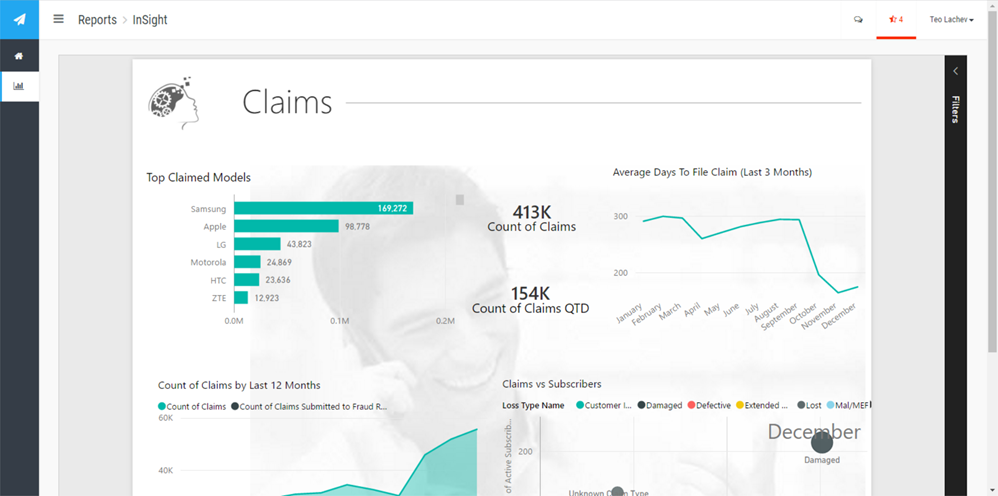
Excel users are familiar with drilling through details by double-clicking a cell in a PivotTable report or PivotChart data point. Power BI has silently added a similar feature to let users see the level of detail behind a chart data point in both Power BI Desktop and Power BI Service. This option can be enabled per visual by turning on the See Records option in Power BI Desktop or the same option from the Explore menu when viewing a report in powerbi.com. Interestingly, it's also available when you right-click a data point in Power BI Desktop (this is the first time I've seen a context menu to work in Power BI). Once you enable it, clicking on a chart data point doesn't trigger interactive highlighting (the default behavior). Instead, it navigates you to a new page that auto-generates a Table report whose filters inherit the filters on the main report....
-
Power BI Row-level Security in Preview
May 1, 2016 / 2 Comments »
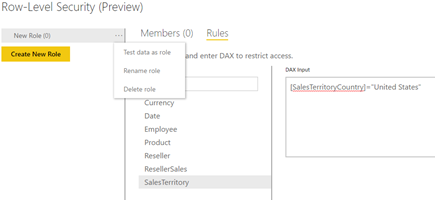
As promised at the Microsoft Data Insight Summit last month, Power BI row-level security for published Power BI Desktop files (aka as cloud models) is now in preview. This means that soon you'll be able to restrict the data that the user is authorized to see based on the user identity. If you have experience in Power Pivot, you'd probably recall that Power Pivot doesn't support row-level security. If the user gains access to the model, the user can see all the data. Row-level security requirements for Power Pivot would necessitate migrating to Tabular. This is still a limitation for Excel Power Pivot models. However, if you use Power BI Desktop and publish the file to Power BI, you can now create roles that use rules (similar to DAX filters). Row-level security is well documented here. From an implementation standpoint, Microsoft has decided to externalize row-level security in Power BI....
-
Prologika Power BI Showcase – Supply Chain
April 27, 2016 / No Comments »
I'm excited to announce the second Prologika Power BI Showcase - Supply Chain that was added to the Power BI Partner portal! It's based on the work we did for the world's largest package delivery company and a provider of supply chain management solutions. Prologika designed a Power BI-based solution for a Fortune 50 organization to consolidate data sources and customer service reports and make them available on mobile devices. Problem This large organization wanted to strengthen its value and growth by redesigning current processes, improving business flexibility, time-to-market, innovation, and customer experience. Customer Service managers had to print or bring people into their office to review operational statistics with their representatives and team. This was taking additional management time to create the reports and then time to pull the representatives off the floor. Management needed a mobile solution for reviewing customer representative and team operational statistics. At the same time, security and...
-
Atlanta MS BI Group Meeting on Apr 25th
April 21, 2016 / No Comments »

MS BI fans, join me for the next Atlanta MS BI Group meeting on Apr 25th and 6:30 PM. Paco Gonzalez will present the Azure Internet of Things(IoT) and I'll show you Power BI Embedded Azure cloud service. SolidQ will sponsor the event. Don't forget to RSVP at atlantabi.sqlpass.org so we can't an accurate headcount. Rate this meeting http://aka.ms/PUGSurvey, PUG ID: 104 Presentation: Introduction to Azure Internet of Things (IoT) Level: Intermediate Date: Monday, April 25th, 2016 Time 6:30 – 8:30 PM ET Place: South Terraces Building (Auditorium Room) 115 Perimeter Center Place Atlanta, GA 30346 Overview: The Internet of Things (IoT) is the network of physical objects—devices, vehicles, buildings and other items—embedded with electronics, software, sensors, and network connectivity that enables these objects to collect and exchange data. The Azure Internet of Things (IoT) Suite brings the Internet of your things to life. Connect your devices, analyze previously-untapped data,...
-
Load Testing Tabular
April 17, 2016 / No Comments »

I while back I did a TechEd presentation "Can Your BI Solution Scale?", when I discussed a methodology for load testing SSAS and SSRS. A customer wanted to ensure that its Tabular model can scale to thousands of deployed users when it goes live. You can still use the excellent Microsoft-originated AS Load Sim framework that I demonstrated in the presentation to load test Tabular. And you can use it can send both MDX and DAX queries. One aspect that deserves more attention is how to tweak the framework to parameterize DAX queries. The framework was design to parameterize MDX queries with tupples. For example, if you want to parameterize an MDX query by month, you can specify the set NonEmpty( [Date].[Calendar].[Month].Members, [Measures].[Internet Sales Amount] ). Then, the framework executes the set and assigns tupples from the set in random so you don't just get cached results from the same query....
-
SSRS UX Changes in SQL Server 2016
April 16, 2016 / No Comments »
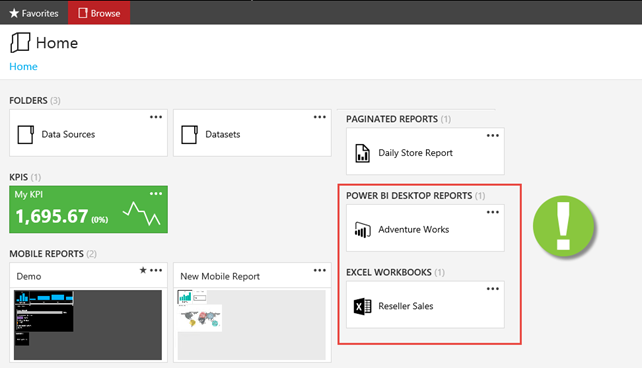
SQL Server 2016 RC3 (last and feature complete RC) just came out for public review. It includes a couple of interesting UX enhancements. The first one is more of a teaser but shows you that Microsoft is committed to fulfill and go beyond its reporting roadmap. SSRS in native mode plays a central role in this roadmap as the on-premises BI reporting platform. The new portal (the old Report Manager portal is gone BTW) now includes sections if you upload Power BI Desktop files and even Excel workbooks! For SQL Server 2016 RTM timeframe, clicking a file of these two types simply opens it on the client with the corresponding application (Power BI Desktop for PBIX files and Excel for Excel workbooks). So, no embedded web rendering yet but I guess these features won't be there if Microsoft isn't prepared to travel the full distance after RTM. Second, we now...
-
Why Business Like Yours Choose Power BI Over Sisense
April 13, 2016 / No Comments »
As Power BI gains a momentum, expect attacks from vendors to intensify. Do you know that there are thousands of vendors offering BI tools! There is not a month passed by when I'm not asked about some cool vendor. I usually don't criticize other vendors but sometimes I get provoked by their audacity and I need to keep 'em honest. Recently, a customer shared a Sisense whitepaper "Why Business Like Yours Choose Sisense over Power BI" and asked about my thoughts. The whitepaper is not published yet but I guess it will be soon as Sisense has deployed another battle card "Why Business Like Yours Choose Sisense over QlikView" that's already in the open. Overall, Sisense appears to be a just another pure self-service BI player that it's trying to aggressively get noticed and refuses to see further then its nose. Judging by their mantra on YouTube and elsewhere, data warehousing is dead, OLAP...
-
Granting Publishing Rights to Power BI Enterprise Gateway
April 8, 2016 / No Comments »
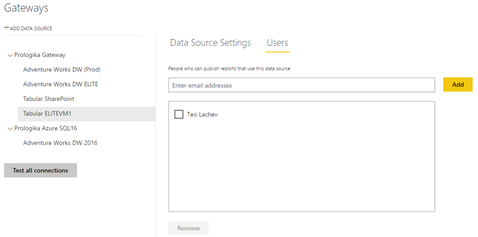
As I explained in a previous blog, the Power BI Enterprise Gateway allows Power BI reports to connect to on-premise data source. A gateway can support multiple data sources. When setting up a data source, you'll see the Users tab on the data source properties. The users you add here will have rights to publish reports that can connect to a data source serviced by the gateway. This is another security check that Microsoft implemented to limit the number of people who can expose data via the gateway. If a user is not in the Users tab, the user can publish a Power BI Desktop file to My Workspace (or to another Power BI workspace if it has rights) but the user won't be able to view reports that connect to a gateway data source. When the user attempts to do so, Power BI will show an error that it...
-
Power BI Embedded
April 7, 2016 / No Comments »
Embedding reports is an extremely popular scenario for ISVs and developers coding external (customer-facing) applications. As I wrote a while back in my "Power BI Embedded Dashboards Without Authentication UI" blog, Power BI supports REST APIs that allow developers to embed dashboards and reports. However, these APIs don't support custom security so you have to provision users with Power BI. Furthermore, a hybrid architecture (reports definitions in the cloud and data on premises) requires Power BI Pro license for each user. This pricing model could quickly become overly expensive if you have to onboard hundreds of users. Power BI Embedded, available for preview on April 1st, aims to remove these obstacles. Designed as an Azure service, it doesn't require changes to the application security. For example, if your application uses Forms Authentication, users can still continue logging in using a user name and password. The application then calls the Azure APIs...
-
Power BI SandDance Visual
March 27, 2016 / No Comments »
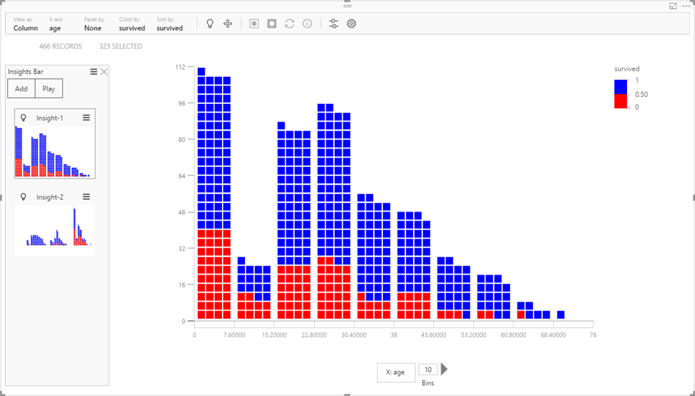
One of the announcements from the Data Insights Summit was the SandDance custom visual. Originating from Microsoft Research and coded in SVG, it not only allows you to visually explore data in versatile ways but it also demonstrates how far your custom visuals can go. This is a super visual that combines multiple visualizations, including column chart, grid, scatter chart, density chart, stack chart, and squarify chart (similar to Treemap) visualization. It also demonstrates animations and storytelling with data. You can test the visual outside Power BI with some predefined datasets by going to https://sanddance.azurewebsites.net. Or, you can download it from the Power BI Gallery and try it with your data in Power BI Desktop and Power BI service. When you compare visualization tools, pay attention to how open their capabilities are. Power BI provides several extensibility features. Custom visuals let any web developer extend the Power BI visualization features...
Training
 We offer onsite and online Business Intelligence classes! Contact us about in-person training for groups of five or more students.
For more information or to register click here!
Books
 Learn Power BI at your own pace with our latest book Applied Microsoft Power BI. Targeting information workers, data analysts, pros, and developers, It is designed as an easy-to-follow guide for learning how to implement BI solutions spanning the entire personal-team-organizational BI spectrum.

