Drill Your Way with Power View
Although it might not be immediately obvious, Power View supports various options for exploring data in more details. Although some scenarios are not natively supported, workarounds could be available.
Drilling Down
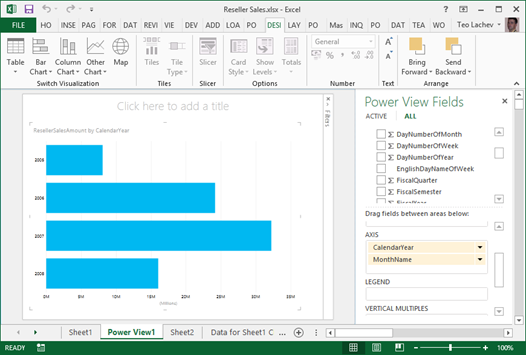
Drilling down involves navigating through multiple fields from the same or different dimensions to explore data at a lower granularity. Every interactive tool supports drilling down (and drilling up) and Power Pivot is no exception. For example, if you have a visualization that has multiple fields in a given zone, such as the AXIS zone, you can double-click a series to drill down to the next level. In the example below, I can double-click the Year series to see the data by Month.
Drilling down is not automatically enabled for Table and Matrix visualizations because by default they show all fields in separate columns. What if you want one column but still be able to drill down?
- If you haven’t done this already, convert the Table visualization to a Matrix visualization.
- Expand the Show Levels button and click “Rows-Enable Drill Down One Level at a Time” assuming you want to drill down on fields placed on rows.
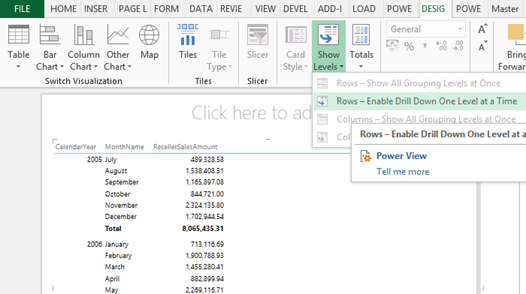
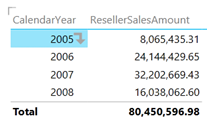
This will collapse all row fields to a single column. However, when the user clicks a field value, a down arrow indicates that this field is drillable. The user can click the arrow or double-click the field value to drill down or up if the field has been drilled to a lower level already.
Drilling Through
While drilling down is typically performed in the context of dimension tables, drilling through allows the user to see the details behind an aggregated value which is typically a numeric measure from a fact table. For example, Analysis Services and Power Pivot supports default drillthrough allowing the user to double-click on a cell in an Excel pivot report to see the individual rows as they were loaded from the data source, such as the sales transactions loaded from a ResellerSales fact table. As it stands, Power View doesn’t support Analysis Services actions and the user cannot double-click an aggregated value, such as on a field placed in the Values zone. Nor it allows the report to be extended with additional SSAS actions.
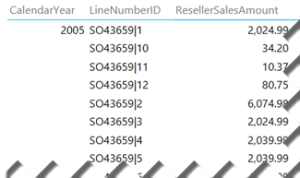
If you want to see the individual rows and the table includes a unique identifier, such as Transaction ID, you can simple drag that field on the Rows zone of a Table or Matrix report. If the table doesn’t have a unique identifier, you can manufacture one by concatenate multiple columns together. For example, the LineNumberID field in the screenshot below uses the DAX expression =[SalesOrderNumber] & “|” & [SalesOrderLineNumber].
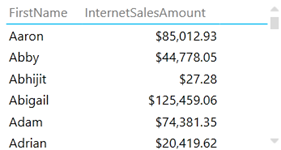
Sometimes, you may have duplicate field values, such as two customers who have the same first name. By default, Power View will show the distinct values and aggregate the results. For example, the following report shows a single row for Aaron although there are multiple customers whose first name is Aaron.
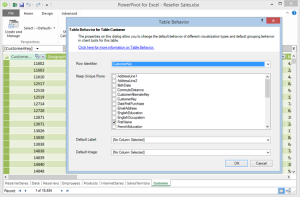
The modeler can use the Power View Table Behavior feature to instruct the client tools not to aggregate results across specific fields. For example, with the changes shown in the following screenshots, the report now will show as many Aaron rows as the number of customers that have Aaron as a first name.
Drilling Across
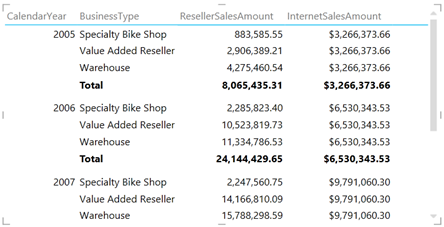
Drilling across allows us to analyze data across multiple fact tables at the same level of granularity assuming there are common (conformed) dimensions that join the fact tables. As a result, we can create a consolidated report that shows both ResellerSalesAmount from the ResellerSales table and InternetSalesAmount from the InternetSales table grouped by common subject areas, such as Date and Product. What happens if the report has to include a field that is related to only one of the fact tables? Power View will repeat the fact aggregates that are not related. For example, in the report below, InternetSalesAmount is repeated across BusinessType because this field is from the Reseller table which is not related to the InternetSales table.
NOTE Drilling across fact tables could be more challenging due to the way dimension relationships work. In SSAS and Power Pivot, relationships represent inner joins. Suppose you have two tables: FactOrdersPlaced and FactOrdersShipped. Both of them are joined to a Date dimension table. Let’s say that the user drills down to a particular order in FactOrdersPlaced and wants to see the transactions in FactOrdersShipped associated with the that order. Even if you have an Order Number dimension that joins FactOrdersPlaced and FactOrdersShipped, you won’t be able to get the expected results because the date when the order was placed will probably be different than the ship date. What you really need here is an outer join between fact tables. A workaround that works across all reporting tools is to add a consolidated fact table that combines the two fact tables. Another workaround that applies only to tools that support actions, such as Excel and PerformancePoint, is to create an SSRS report that queries directly the data warehouse.


