Coming back from a long vacation, I’ve almost missed this interesting Power BI enhancement: Power BI unmaterialized calculated columns. Normally, I avoid the traditional DAX calculated columns for a variety of reasons, such as confusion about where business logic is applied, limited support across storage modes (for example, Direct Lake doesn’t support them), longer refresh times, etc. This not to say that calculated columns can't…
I’m helping an enterprise client modernize their data analytics estate. As a part of this exercise, a SSAS Multidimensional financial cube must be converted to a Power BI semantic model. The challenge is that business users ask for almost real-time BI during the forecasting period, where a change in the source forecasting system must be quickly propagated to the reporting the layer, so the users…
Atlanta BI fans, please join us in person for our next meeting on Monday, January 5th at 18:30 ET. Dean Jurecic will show you how Power BI visual calculations can simplify the process of writing DAX. And your humble correspondent will walk you through some of the latest Power BI and Fabric enhancements. Key2 Consulting will sponsor the meeting. For more details and sign up,…
When it comes to Generative AI and Large Language Models (LLMs), most people fall into two categories. The first is alarmists. These people are concerned about the negative connotations of indiscriminate usage of AI, such as losing their jobs or military weapons for mass annihilation. The second category are deniers, and I must admit I was one of them. When Generative AI came out, I…
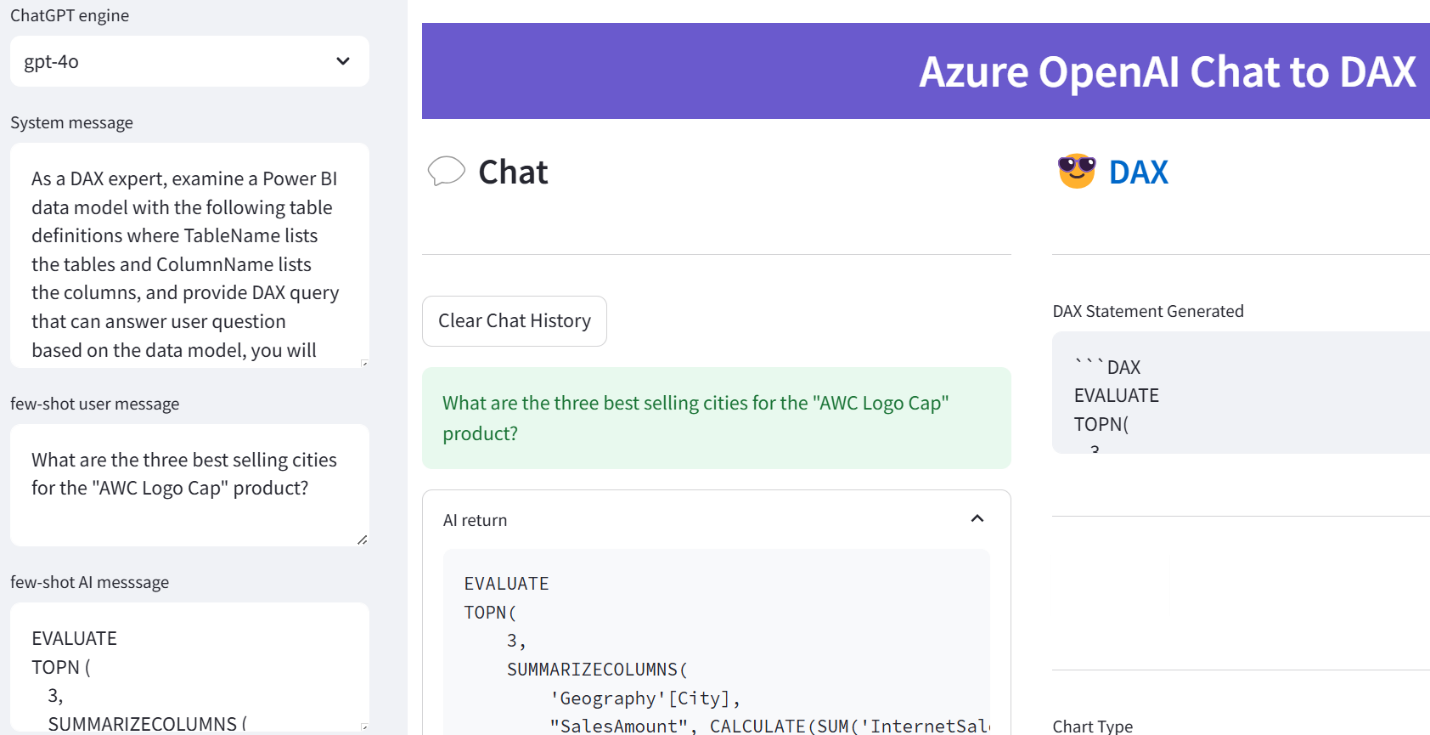
In my previous post, I covered how large language models, such as ChatGPT, can be used to convert natural queries to SQL. Let’s now see how Text2DAX fairs. But wait, we have a Microsoft Fabric copilot already for this, right? Yes, but what happens when you click the magic button in PBI Desktop? You are greeted that you need to purchase F64 or larger capacity.…
One of the main goals and benefits of a semantic model is to centralize important business metrics and KPIs, such as Revenue, Profit, Cost, and Margin. In Power BI, we accomplish this by crafting and reusing DAX measures. Usually, implementing most of these metrics is straightforward. However, some might take significant effort and struggle, such as metrics that work at aggregate level. In an attempt…
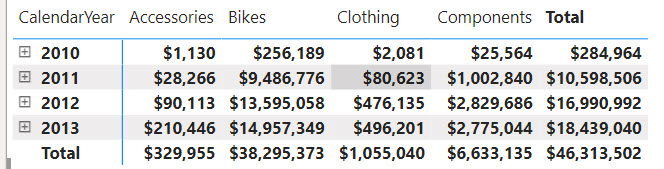
The February 2024 release of Power BI Desktop includes a preview of visual calculations. As its name suggests, a visual calculation is a visual-scoped DAX measure that works at the aggregate (visual) level. The Good Visual calculations make previously difficult tasks much easier. Consider the following matrix: Suppose you need a measure that calculates the difference between the product categories in the order they were…
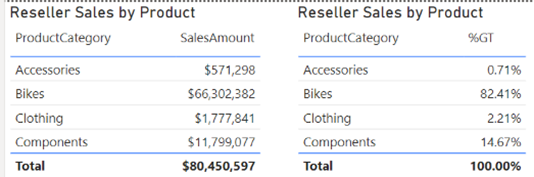
Suppose you need to calculate a percentage of grand total measure. Easy, you can use the Power BI "Show value as" without any DAX, right? Now suppose that you have 50 Table visuals and each of them require the same measure to be shown as a percentage of total. Although it requires far more clicks, "Show value as" is still not so bad for avoiding…
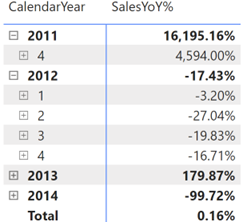
DAX can get complex and humble even experienced BI developers. Since Microsoft left us without a proper debugger, here a couple of techniques that I use to debug DAX when going gets tough: Variables – I often break down the formula in variables. As a bonus, variables make expressions easier to read and might yield performance gains. Consider the following SalesYoY% measure that calculates the…
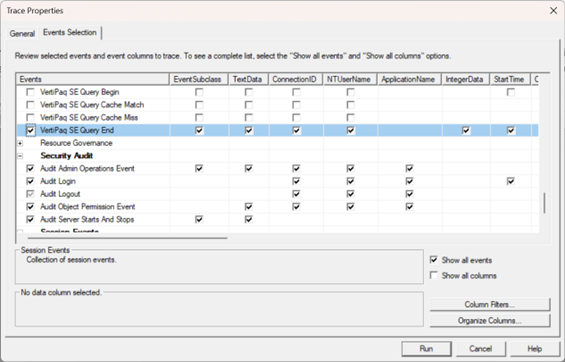
Usually, DAX queries execute very fast, like flashes in a gold seeker's pan. Sometimes, however, you could end up with a massive DAX query that takes minutes if not hours. For example, a financial institution requested credit monitoring results to be evaluated overnight and saved in a relational database for fast retrieval. The query involved processing some 300+ measures for 40 million customers and took…