Testing DAX Measures
DAX can get complex and humble even experienced BI developers. Since Microsoft left us without a proper debugger, here a couple of techniques that I use to debug DAX when going gets tough:
-
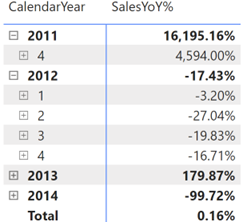
Variables – I often break down the formula in variables. As a bonus, variables make expressions easier to read and might yield performance gains. Consider the following SalesYoY% measure that calculates the variance in sales between the current period and same period last year.
SalesYoY% =
VAR _LastYearSales =
CALCULATE (
[InternetSales],
SAMEPERIODLASTYEAR ( 'Date'[Date] )
)
RETURN
IF (NOT ISBLANK([InternetSales]), DIVIDE ([InternetSales] - _LastYearSales, _LastYearSales))

Let’s say you believe that last year’s sales look suspicious, such as the high value for 2011. You can comment the last line and return the LastYearSales variable to investigate further.
SalesYoY% =
VAR _LastYearSales =
CALCULATE (
[InternetSales],
SAMEPERIODLASTYEAR ( 'Date'[Date] )
)
RETURN
_LastYearSales
--IF (NOT ISBLANK([InternetSales]), DIVIDE ([InternetSales] - _LastYearSales, _LastYearSales))
-
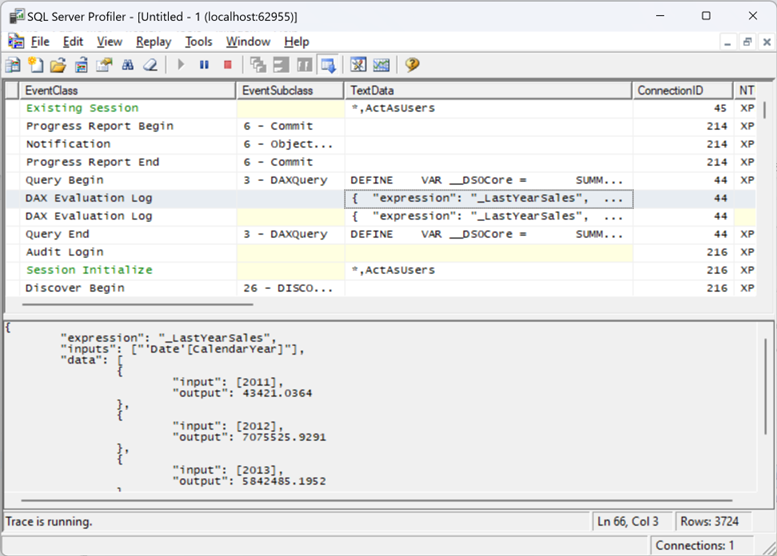
The EvaluateAndLog function – With the introduction of the EvaluateAndLog function in Power BI, Microsoft has provided us with a poor man’s debugger that can print the output of a DAX expression. For example, to investigate the last year’s sales, you can enclose it with EvaluateAndLog.
SalesYoY% =
VAR _LastYearSales =
CALCULATE (
[InternetSales],
SAMEPERIODLASTYEAR ( 'Date'[Date] )
)
RETURN
IF (NOT ISBLANK([InternetSales]), DIVIDE ([InternetSales] – EvaluateAndLog(_LastYearSales), _LastYearSales))
Then, you can use the SQL Server Profiler (distributed with SSMS) or the tool mentioned in the blog to see the output. I have the SQL Server Profiler registered as a Power BI Desktop external tool using the steps in this blog so that I can conviniently launch it connected to the Power BI Desktop model. Once the profiler opens, make sure to select the “DAX Evaluation Log” event.
In this case, the event outputs the last year’s sales broken by year because the visual slices the measure by years.