Intelligencia for Silverlight
After retiring Office Web Components (OWC), which can hardly can pass the web test as it is implemented as an ActiveX control, Microsoft left developers with no web-based browser for Analysis Services. True, for those who can afford the hefty price tag, Microsoft Office SharePoint Server (MOSS) supports server-side Excel spreadsheets that render to HTML. However, while Excel rules the Windows-based OLAP browser space, HTML-based Excel spreadsheets with limited filtering can hardly meet the demand for web-based interactive reporting. Then, there is an option to author Reporting Services OLAP reports but outside limited interactive features their layout is pretty much fixed at design time.
What’s really needed is a Silverlight Analysis Services control that ships with Visual to let developers embed an Excel-like Analysis Services browser into their ASP.NET applications. You need this control and I need it but it’s not coming anytime soon. Meanwhile, third-party vendors rush in to fill the gap.
In a recent project, we used Dundas OLAP Chart for Analysis Services, which I mentioned in one of my previous blogs. Dundas has just released version 7 of this control and I really like what I see. It’s currently the best OLAP-based chart in the industry. The Dundas OLAP Chart for Analysis Services is a regular ASP.NET control with AJAX features for improved user experience. With Silverlight establishing as the web platform of choice for web developers, you may be looking for a Silverlight-based Analysis Services browser. This is where the Intelligencia for Silverlight comes in.

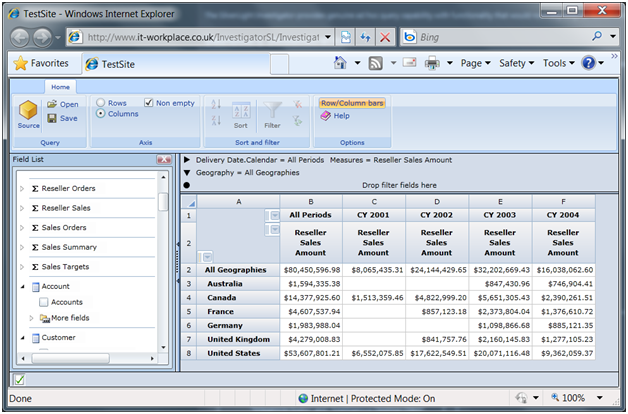
I blogged about Intelligencia for Reporting Services before and pointed out where I think it surpasses the MDX Query Designer included in Reporting Services. What IT-Workplace has done this time is bringing their product to the web and it has wisely decided to use Silverlight. The moment I saw the new version, it grabbed my attention. Users familiar with Excel PivotTable reports would find the Intelligenca metadata pane (Field List) very similar. Users can create a report by dragging and dropping objects to the report pane on the right. Actually, I would love to see IT-Workplace adding the Filter, Columns, Rows and Filter panes below it just like Excel. I’d welcome also in-place filtering just like Excel. You got the idea. For me and my users, the more Excel-like the browser is the better. This lowers the learning curve and unifies the desktop vs. web experience.
But Intelligencia for Silverlight is more ambitious than just bringing Excel-like reporting to the web. The control has scriptable interface and a filter control which allows management dashboards to be created by linking grids and filters, as the first link on the web page demonstrates.
In summary, while still rough around the edges (it’s currently in a beta phase), I think Intelligencia for Silverlight has a lot of potential and is positioned to fill in a wide gap left by Microsoft by letting web developers embed an Analysis Services OLAP browser in their applications. Powered by Silverlight, Intelligencia for Silverlight could bring Excel PivotTables to the web. Visit the Intelligencia for Silverlight web page, download and test the control, and provide feedback to improve the control


