Nevron Chart for Reporting Services
Nevron was kind enough to show me their chart and gauge for Reporting Services. In certain areas, their products exceed the charting capabilities of Reporting Services. Here are the highlights:
- The product provides support for SQL Server Reporting Services (SSRS) 2005, 2008, 2008R2 and SQL Server Data Tools (SSDT) 2012.
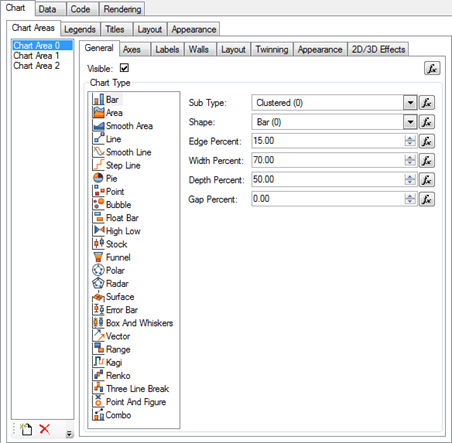
- Advanced Chart Designer

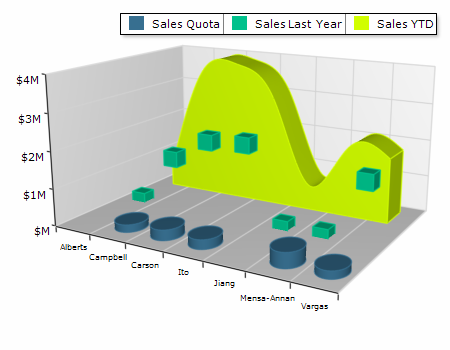
- Complete set of 2D and 3D Charting Types
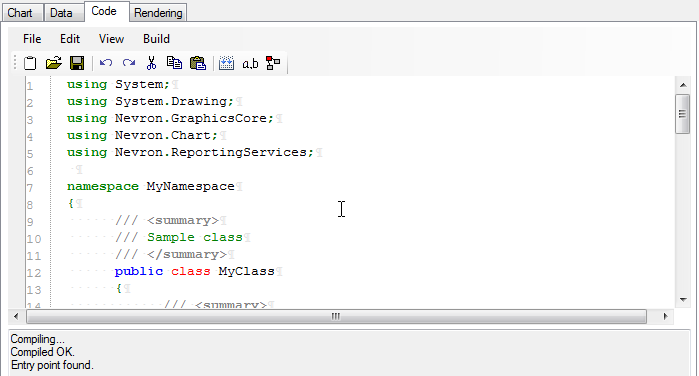
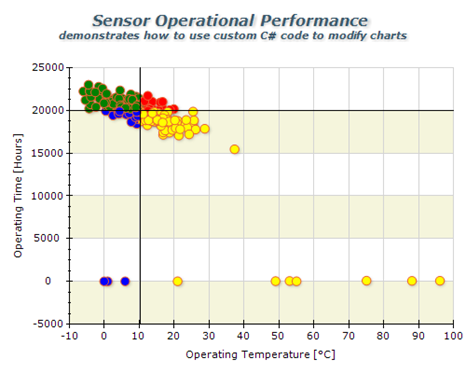
Support for Code Customization – Nevron Chart for Reporting Services supports customization through C# code, which allows you to use the full Nevron Chart for .NET API in SSRS and achieve a higher degree of customization.


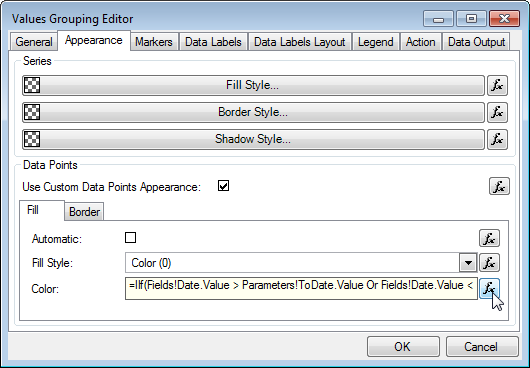
- Expressions Everywhere – Nearly all properties of the Chart report item can now be specified by expressions. Appearance styles (fill, stroke, shadow and text) are also reworked to support both constant specification and specification that is based on expressions. This allows you to bind nearly all configurable aspects of the report item to user defined parameters and/or data.

- Support for 2D/3D Combo Charts – Combo Charts are used to combine certain series types within the same chart area.

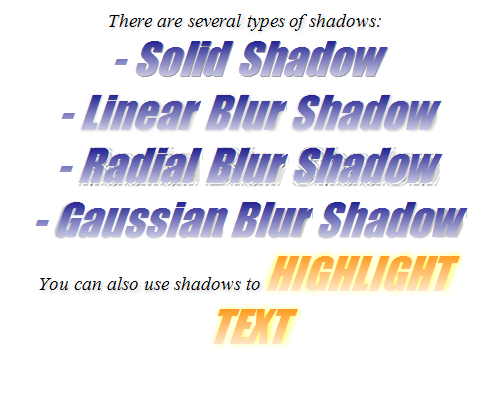
- XML Formatted Texts – This feature is applicable to all elements which display text. It allows you to mix fonts, mix bold, italic underline formatting and many other advanced features like different fill styles, shadows, image filters etc. – all inside a single label, title etc.

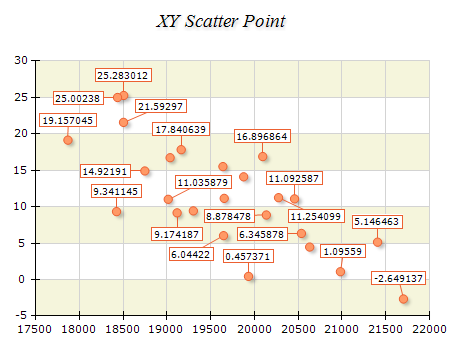
- Non-overlapping Data Labels Layout – All Cartesian Chart types support automatic non-overlapping data labels layout. The data label layout prevents labels from overlapping in both ordinal and scatter charts and works in 2D and 3D appearance modes.

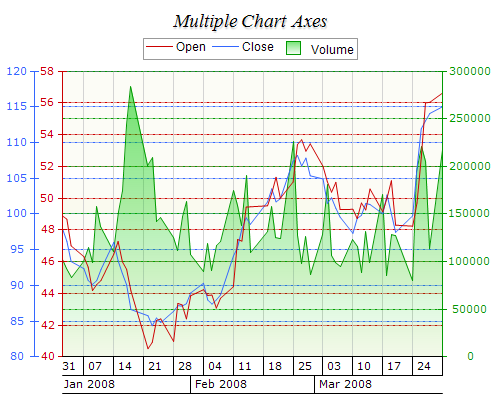
- Advanced Axis Model – complete set of axis-related features designed to target even the most compelling charting requirements.
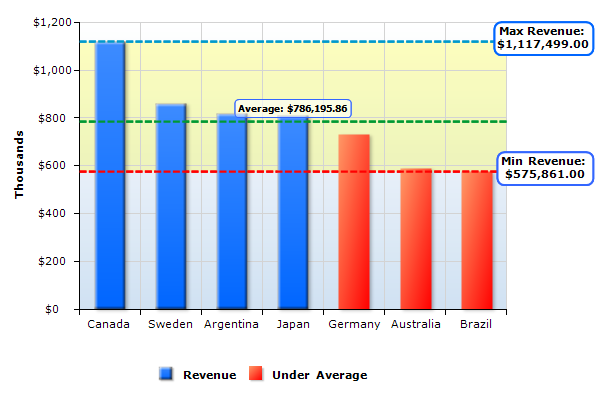
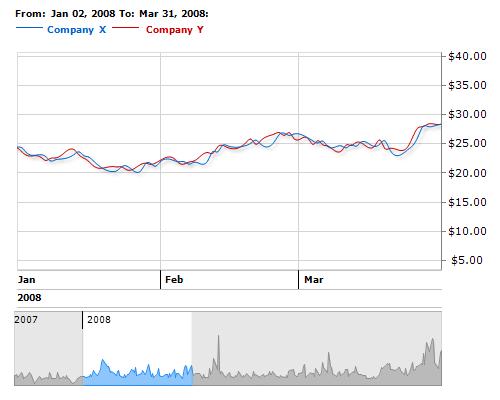
The online demo is available at: http://examplesssrsvision.nevron.com/

