
Brightstar Improves Business Performance Management

Customer: Brightstar
Website: http://brightstar.com/
Industry: Insurance
Customer Profile
Brightstar simplifies the wireless world, making mobile technology accessible to everyone. We look after every stage of a device’s lifecycle for our customers, from the moment it’s manufactured to the moment it’s time to trade it in and re-market it – putting us at the heart of the wireless ecosystem.
Value to Customer
Helped Brightstart improve Business Performance Management.
Implemented a semantic model that meets complex business requirements.
Automated the entire process.
Brightstar Improves Business Performance Management
Industry: Insurance
Brightstar improved their Business Performance Management processes with a customized solution developed by Prologika.
Business Needs
Business Performance Management (BPM) is a methodology to help the company predict its performance. An integral part of a BPM strategy is a process for Budgeting, Planning, and Forecasting which is typically performed by the Finance department. When it comes to Finance, nothing is simple and BPM is no exception. The temptation is to buy a prepackaged software but even that route would require a lot of customization and compromises. To gauge complexity, let’s look at some of the business requirements Prologika faced.
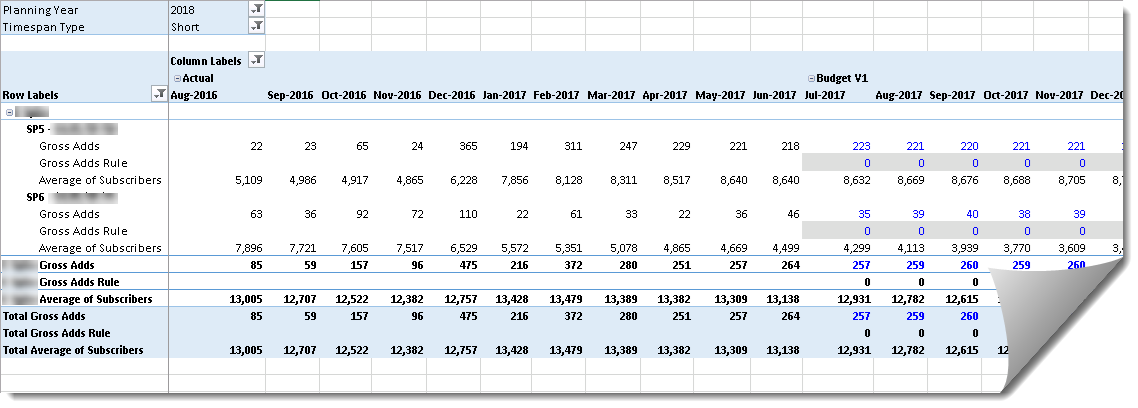
Similar to a Telco, this company has customers and service plans. As a B2B organization, their customers are other companies. Planning is done at the customer and service plan level, and across multiple subject areas. For example, the Excel report shows a subset of the measures for planning growth of the customer base. The planner can change the budget and forecast values of some measures, called drivers. For example, the planner can overwrite Gross Adds for future periods. Further, the planner can overwrite a rule in each cell to change how the driver cell value is computed. The rules are:
- 0 (default rule) – By default, planned values are calculated as 3-mo average of previous periods. For example, Gross Adds for Aug 2017 for the first plan is 221 and has a Gross Adds Rule of 0. This means that the system will calculate the value as a 3-mo simple average of the values of the previous three months (221, 218, and 223). Note that a previous month might fall in the Actuals range. Also notice that recursive calculations are required, where the value of each month is based on the same measure for previous periods.
- 1 (6-mo average) – Instead of 3-mo average, 6-mo average is used.
- 2 (seasonality index) – The value is computed by multiplying the driver values for the past 12 months by a seasonality index.
- Any other value – The planner enters the driver value manually.
The driver measures are used to calculate other (output) measures. For example, Average of Subscribers has a formula that is based on Gross Adds and other measures. Finally, the drivers and output measures are allocated across a Chart of Accounts dimension (not shown on the report) to give managers the financial perspective of how the company is doing.
Solution
Previously, the company has used an Excel-based home-grown solution for BPM . However, the process was manual, lengthy, error-prone, and it couldn’t give management a quick and accurate picture of the company’s performance. A Business Analytics group was responsible for retrieving and consolidating actuals. Then, the Finance group would manually input actuals into an Excel template. Complicated Excel formulas were used to calculate drivers and output measures but even Excel had difficulty with more complex recursive measures. Most of the time and effort was spent on working the system than on business performance management. The company looked at other high-end financial solutions, with a starting price tag of $300K, plus yearly maintenance fees and consulting feeds. At the end, the company entrusted Prologika to implement the solution.
We used Analysis Services 2016 Multidimensional, Initially, we considered Tabular but we realized that the solution complexity exceeded the Tabular capabilities, including:
- No support for writeback – Currently, Tabular doesn’t writeback although third-party solution such as Power Planner can be overcome this limitation.
- No support for recursive measures – Currently, Tabular doesn’t support recursive measures, where the measure DAX formula references the same measure.
- No scope assignments – Tabular doesn’t support scope assignments for allocations.
- No parent-child dimensions and hierarchy functions – Tabular doesn’t support parent-child hierarchies and functions for navigating the hierarchy, such as Parent, Children, etc.
Benefits
Prologika helped Brightstar to transform its BPM processes.
- Automated retrieval of actuals from the company’s data warehouse (also designed by Prologika)
- A highly-customized solution that meets complex business needs
- Management has immediate access to actuals, budget, and forecast
- Elimination of manual entry and data errors.
- Ability to analyze company’s performance by various perspectives (customer, service plan, time, chat of accounts).


