Posts

App Integration Tools and Patterns

“…That’s when the teardrops start, fella…
…Dirty deeds and they’re done dirt cheap”

“Dirty deeds done dirt cheap”, AC/DC

A few months ago, I did an assessment for a large organization seeking to modernize their data analytics processes. As a part of standardizing the toolset, the client was considering Salesforce MuleSoft for both application and data integration. After all, the vendor told them the tool can do “everything”. Indeed, taken from the vendor page, we learn that “MuleSoft is a platform that gives IT the tools to automate everything. This includes integrating data and systems, automating workflows and processes, and creating incredible digital experiences — all on a single, easy-to-use platform.”

Let’s parse this claim.

Defining integration types

Quick as a bunny and excited that I finally have one tool that does it all, we hop to the Gartner’s Magic Quadrant for Data Integration Tools. Surprise, Salesforce MuleSoft is not even there. Where is MuleSoft? It’s on the Gartner’s Magic Quadrant for Integration Platform as a Service and the Magic Quadrant for API Management. Confused? Let’s start with definitions.

Data integration (note the focus on data)

“Gartner defines data integration as the discipline that includes architectural patterns, tools, and methodologies for accessing, harmonizing, transforming, processing, and moving data across various endpoints and infrastructures. It ensures consistent access and delivery of data across different subject areas and structures to meet business and application needs.”

Integration Platform (note the focus on applications)

“Gartner defines integration platform as a service (iPaaS) as a vendor-managed cloud service that enables end users to implement integrations between a variety of applications, services and data sources, both internal and external to their organization.”

API Management (note the focus on APIs)

“Gartner defines the application programming interface (API) management market as the market for software that supports API life cycle stages such as planning and design, implementation and testing, deployment and operation, and versioning and retirement.”

So, should we use MuleSoft for ETL and data integration patterns typically involving large data volumes, such as to load a data warehouse? I say we don’t. You probably could, but it will be like trying to fit a square peg into a round hole. Did that client try it despite my advice against it? They did and came to the same realization. Should we consider MuleSoft for enterprise-level app integration, such as something happening in one system triggers something happening in another system by calling APIs? Probably, that’s what’s designed to do anyway. Let’s choose the right tool for the job.

Application integration done dirt cheap

What about a true application integration scenario? In a current assessment, a client uses a third-party app which stores data in a SQL Server database. Each subsidiary has its own database that tracks invoicing locally through the app. However, a central NetSuite ERP system is used to consolidate invoices from all subsidiaries. So, the integration task at hand is to implement a bi-directional synchronization where each new local invoice (and its associated line items) is exported to NetSuite and the local invoice is then updated with the corresponding NetSuite transaction id (it’s more complicated than this but you get the idea).

Now this is where we can surely use “specialized” tools like MuleSoft, Boomi, Celigo, etc., right? And we surely pay a premium, to the likes of thousands of dollars per month. I don’t claim to know these tools but for the most part they appear to me as nice UI wrappers on top of the vendor APIs. They certainly avoid dealing with the actual API complexities, JSONs, etc, but should you lock yourself and break the bank for small scale app integration? Nowadays, everyone wants to do more with less.

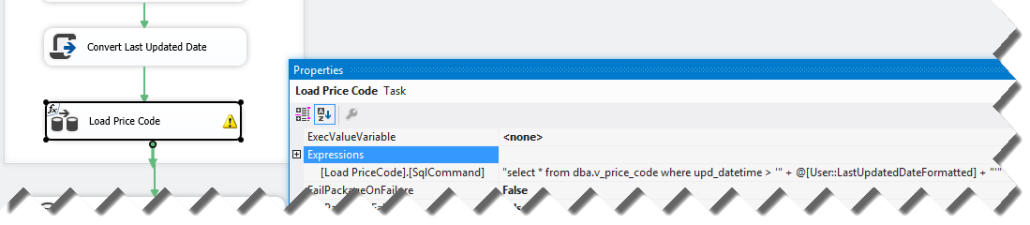
Therefore, knowing and using the Microsoft Azure stack, my personal choice is to first consider Azure Data Factory. True, it’s a generic data integration tool and I must learn how to call the vendor APIs and deal with JSONs but it’s not a big deal (AI to help here). ADF can even do webhooks. And it will save you tons of money.

A group of people standing around a large device AI-generated content may be incorrect.


Fixing SSIS Crashes

I’ve spent hours on this so someone else might find the solution useful. I’ve developed an SSIS package that uses a ForEach Loop container. Then, I closed Visual Studio and reopen it. The SSIS designer opens the package, thinks for a few seconds if it likes it or not, and then it crashes Visual Studio. I’ve noticed that the VS status bar shows a message that it validates the ForEach Loop container, which was an important clue.

How do we fix this horrible issue? Initially, I was thinking that it was interference from Visual Studio 2022 that someone else has recently installed. So, I upgraded, uninstalled, repaired, tried VS 2022, etc. to no avail.

Finally, I open the package code in text editor and added “DTS:DelayValidation=”True” to the container task to disable the upfront validation on package open.

This fixed the issue although I had no idea what caused the crash.

<DTS:Executable
 DTS:refId="Package\Foreach Loop Container"
 DTS:CreationName="STOCK:FOREACHLOOP"
DTS:DelayValidation="True"
...

Auditing Row Counts in SSIS

It’s a good practice to have a custom ETL framework that augment the SSIS capabilities. ETL frameworks come in different shapes and sizes but what I’d like to see in a framework is:

  1. Configurable parallelism – Does your ETL take hours? The chances are that your packages run sequentially. Or, disconnected flows in the master package’s control flow support limited parallelism, while your server probably has much bigger pipeline. By contrast, the framework we use support configuring the degree of parallelism and automatically distributes packages to be executed on different threads.
  2. Target and actual package execution duration – You must proactively monitor when the actual package execution exceeds its target duration. See my newsletter “Is ETL (E)ating (T)hou (L)ive?” of a real-life example of what could happen if you don’t do this. Plan to implement an ETL dashboard for monitoring the package execution against its target and to let the users know what date the data is current as by every source system.
  3. Restartability – Resume package execution from the point of failure.
  4. Sufficient auditing checks to ensure data quality – This is usually done by recording row counts of extracted, inserted, updated, and deleted rows. I’d also like to see ETL packages doing some quality checks to ensure the data is consistent as it moves through the pipeline (source, staging, DW, cubes).

I’m currently auditing an ETL implementation where the original developers didn’t record row counts. Citing regulatory requirements, such as The Sarbanes-Oxley Act, the ETL was later”enriched” to record before and after row counts of every possible DML operation. If this is the stated business requirement, then that’s fine but before you start on this this path, consider that the SSIS catalog provides counts for data flow tasks. Before SQL Server 2016, collecting these counts would require enabling Verbose logging. This wasn’t a recommended practice because of the additional overhead. However, in SQL Server 2016 you can create a custom logging level to record only the things you need. Follow these steps to create  custom logging level in order to capture row counts:

  1. Right-click the SSIS catalog and then click Customized Logging Level. Click the Create button and choose which of the system-defined logging levels you want to use as a base, e.g. Basic.
  2. To record the row counts, make sure to select Component Data Volume Statistics in the Statistics tab.
  3. When configure your job with SQL Server Agent, go to the Configuration tab, click the Advanced Tab, and then select the custom logging level you created in the “Logging level” drop-down.

Because the row counts are recorded for each buffer in the data flow task, in SSMS connect to the SSISDB database and execute this query to group by package, task, and component to see how many rows has gone through each component over time:

SELECT package_name, task_name, [source_component_name] , max(created_time) as created_time, SUM([rows_sent])  AS rows_sent
FROM [catalog].[execution_data_statistics]
GROUP BY package_name, task_name, [source_component_name]
order by 4

As useful as this is, it captures only the row counts in data flow tasks. It won’t record DML operations that are taking place in the Control Flow, such as in Execute SQL Tasks that are calling stored procedures. If capturing row counts in Control Flow is required, you have to do so on your own.

It’s unlikely that capturing row counts alone would satisfy stringent auditing requirements, such as when was the row changed, what change was made and what was the old values. Instead, consider using another feature introduced in SQL Server 2016 Database Engine: temporal tables. By configuring your destination tables as temporal, you let SQL Server to capture data changes in a history table. Now you have a rich audit trail.

Seeking Oracle Reloaded

Scenario: You create an SSIS 2012 project in SSDT that uses the Attunity Oracle connector. By default, Attunity creates a private connector. You verified that the package connects and executes successfully. Then, you promote connector to a project-level connector so that you can manage the credentials in the SQL Server job configuration across all packages. When you attempt to deploy to the SSIS catalog, you get the following error:

Failed to deploy project. For more information, query the operation_messages view for the operation identifier <X>

When you query the operation_messages view for that message_id, you get the enlightening reason:

Failed to deploy the project. Fix the problems and try again later.:Unable to create the type with the name ‘MSORA’.

Solution: I had my own fair share of Oracle OLE DB driver installation issues, some of which I documented here. I don’t know how this customer managed to mess up the Oracle driver installation (not that it’s hard to do) but the registry settings were off. How do we fix this horrible issue?

  1. Fix the Oracle driver installation.
  2. Remove and reinstall the Attunity drivers. It could be that in this particular case, the customer had both the Attunity 1.2 and 2.0 drivers and they removed the 1.2 version.

Note that you must install both 32-bit and 64-bit Oracle and Attunity drivers. That’s because SSDT (being a 32-bit application) users 32-bit drivers, while the SSIS runtime uses the 64-bit drivers unless you specifically configure the job to run as 32 bit.

Getting ETL Task Duration

Happy New Year!

ETL exceeds the processing time window? Optimizing ETL, starts with obtaining task-level execution times? If you use SSIS 2012 project deployment mode, task-level stats are already loaded in the SSIS catalog and you can use the following query:

SELECT execution_id,

CASE WHEN [status] = 1 THEN ‘created’

WHEN [status] = 2 THEN ‘running’

WHEN [status] = 3 THEN ‘canceled’

WHEN [status] = 4 THEN ‘failed’

WHEN [status] = 5 THEN ‘pending’

WHEN [status] = 6 THEN ‘ended unexpectedly’

WHEN [status] = 7 THEN ‘succeeded’

WHEN [status] = 8 THEN ‘stopping’

WHEN [status] = 9 THEN ‘completed’

END AS [status_text],

DATEDIFF(ss,start_time,end_time) DurationInSeconds

FROM catalog.executions e

What if you are not on SSIS 2012 or later yet or you are not using the project deployment mode or a framework that logs the task duration? You can still obtain the task duration but you need to enable SSIS logging for each package you want to monitor, as follows:

  1. Open the package in BIDS/SSDT.
  2. On the SSIS menu, click Logging. Configure logging to use the SSIS Log Provider for SQL Server. The provider will save the statistics in a SQL Server table so you can easily query the results.010215_2129_GettingETLT1
  3. On the Details tab, select the OnPreExecute, OnPostExecute, and most importantly the OnProgress event so you can get the same level of execution statistics as in the BIDS/SSDT Progress tab.010215_2129_GettingETLT2
  4. Once you configure the SSIS Log Provider for SQL Server, it will create a sysssislog table in the database you specified when you configured the provider. When the SQL Server Agent executes your package, you can use a query like the one below to obtain task-level durations:

    SELECT executionid Execution,

    PackageName = ( SELECT TOP 1 source FROM dbo.sysssislog S WHERE S.executionid = L.executionid AND S.[event] = ‘PackageStart’ ),

    PackageStep = l.source,

         Runtime_min = DateDiff(minute, MIN(L.starttime), MAX(L.endtime)),

    Runtime_hr = DateDiff(hour, MIN(L.starttime), MAX(L.endtime)),

    StartTime = MIN(L.starttime),

    EndTime = MAX(L.endtime),

    FinishDate = CAST(MAX(L.endtime)AS DATE)

    FROM dbo.sysssislog L WHERE L.[event] != ‘PackageStart’
    GROUP BY executionid, L.source

Sybase Integration

A Major League Baseball team engaged us to implement the foundation of their data analytics platform. They partner with TicketMaster for ticketing and sales. Interestingly, besides the TicketMaster cloud hosting that everyone is familiar with, Ticketmaster also offers a client application called Archtics to allow customers to sell tickets on premise. The client application uses a Sybase database (as you probably know, Sybase was acquired by SAP) that syncs with the host. Fortunately, Sybase and SQL Server has a lot in common but in the process we had to figure out a way to pull data from the Sybase database. To do so, you need to follow these steps:

  1. Install the SQL Anywhere Database Client Download. During development, you will need the 32-bit driver because BIDS/SSDT is a 32-bit app. When running via SQL Server Agent, you’ll need the 64-bit driver.
  2. Create an ODBC data source. Again you need to create two ODBC data sources using the 64-bit ODBC Administrator and then 32-bit ODBC Administrator.
  3. Use the ODBC Source in SSIS to extract data from Sybase. Unfortunately, the ODBC Source doesn’t support parameterized statements, such as to extract data incrementally. As a workaround, you can use an expression-based SQL command text. You can do this by clicking on the Data Flow task in the package control flow and setting up an expression for the SQLCommand property.

    101914_2246_SybaseInteg1

Starting SSIS 2012 Job Remotely

Scenario: Inspired by the new SSIS 2012 capabilities, you’ve managed to convince management to install SSIS 2012 on a new server for new ETL development. But your existing ETL is still on SQL Server 2008 (or R2) and there is no budget for migration and retesting. You want to start SSIS 2012 jobs from the 2008 server, e.g. in SQL Server Agent on completion of a certain SSIS 2008 job.

Solution: Courtesy to Greg Galloway for clueing me on this, thanks to its CLR integration, SSIS 2012 supports initiating jobs via stored procedure in the SSIS catalog. Although the process could benefit from simplification, it’s easy to automate it, such as (you guessed it) with an SSIS 2008 calling package. It goes like this:

  1. Call catalog.create_execution in the SSISDB database to create an execution for the SSIS job. At this point, the job is not started. It’s simply registered with the SSIS 2012 framework. Notice that you want to get back the execution id because you will need it for the next calls.

EXEC catalog.create_execution

@folder_name=N'<SSIS Catalog Folder>’,

@project_name=N'<project name>’,

@package_name=N’package name’,

@reference_id=NULL,

@execution_id=? OUTPUT

Note: If you use SSIS 2008 and you declare the variable that stores execution_id (which is a big integer) to be Int64, SSIS 2008 would probably choke due to a known issue with big integers. As a workaround, change the SSIS variable type to Int32.

  1. So that the SSIS 2008 job waits for the SSIS 2012 job to complete, set the Synchronous parameter.
    EXEC catalog.set_execution_parameter_value @execution_id = ?

    ,@object_type=50 ,@parameter_name=’SYNCHRONIZED’

    ,@parameter_value=1

  2. Now you are ready to start the job by calling catalog.start_execution and wait for it to finish.
    EXEC catalog.start_execution @execution_id = ?

  • To get the back the job status, query the status field from the [catalog].[executions] view. A status of 4 means that the job has failed.
    SELECT [status] FROM [SSISDB].[catalog].[executions] WHERE execution_id = ?


  • To get the actual error, query the [catalog].[event_messages] view, e.g.:
    SELECT TOP 1 cast([message] as nvarchar(500)) as message, cast ([execution_path] as nvarchar(500)) as execution_path

    FROM [catalog].[event_messages]

    WHERE operation_id = ? AND event_name = ‘OnError’

    ORDER BY message_time DESC

Tip: If you use SQL Server Agent to start the SSIS 2008 job, use a proxy account to execute the job under a Windows service account that has the required permissions to the SSISDB catalog to start SSIS 2012 jobs.

Announcing Prologika Validator

Data is your biggest asset and today’s currency but the data can be messy. You know it and we’ve seen it – many times. The messier the data, the bigger the headache. At Prologika, we believe that data quality issues should be addressed as early as possible and the validation process should start with the source systems. You need a solution to detect data entry issues without ETL, custom validation code, and exhaustively hard-coded rules. This is why I’m excited to announce today the availability of Prologika Validator!

Available as a cloud service and on-premises offering, Prologika Validator uses predictive analytics to find data anomalies in order to help you improve data quality. It analyzes historical data and discovers common data patterns and relationships. When the user attempts to save a data entry that is outside the norm, Prologika Validator can detect the outlier. Then, the source system can notify the operator about a potential data entry error. As a result, the data is cleaned at the source and wrong data doesn’t end up in downstream systems, such as a data warehouse. Suppose your company buys some products from vendors. The operator responsible for the order entry creates an order in the ERP system, such as Oracle Financials or Microsoft Dynamics. The system might not be capable of detecting a wrong field entry or a wrong combination of fields, such as the user has specified a wrong unit of measurement for the product purchased. However, Prologika Validator is capable of detecting such outliers by predicting the likelihood that the order entry is outside the norm. The validation process is very fast and the operator is notified immediately.

Sounds interesting? Visit the Prologika Validator page and give it a try now. If you want to know how Prologika Validator can help you improve data quality, contact us to discuss your requirements and get a pricing proposal.

SQL Server 2012 ETL Framework Features in the New SSIS Project Deployment Model

When moving to SQL Server 2012, ETL developers would need to rethink custom ETL frameworks. If you embrace the new project deployment model, SQL Server 2012 offers a lot of plumbing features out of the box. Jen Underwood wrote a great SQL Server 2012 ETL Framework Features in the New SSIS Catalog article about what supported and what’s missing. I guess in most cases developers will find that they’ll need to implement incremental features on top of the Microsoft provided toolset that are not supported, such as restartability and execution control, while letting SSIS 2012 handle logging and performance reporting. Another great resource for getting started with the new project deployment model is the SSIS Logging in Denali blog by Jammie Thompson.

We ran into an interesting snag when validating and executing packages using the new project deployment model with Windows integrated security:

  1. Developer initiates the validation and execution in SSMS from his machine.
  2. Packages are deployed to a dedicated SQL Server and packages use Windows integrated security to connect to a SQL Server database on a different server.
  3. The source SQL Server database is on a different server.

As you’ve probably guessed it, this scenario requires configuring Kerberos delegation and registering SPNs for both the SQL Server hosting the SSIS packages and the SQL Server hosting the source database. That’s because validation and execution happen under your login and a double-hop is required to delegate your credentials to the source SQL Server. This can be avoided by using standard security (username and password) to establish connections from your packages to the source SQL Server. This wasn’t an option in our case because customer requirements dictated using Windows security to SQL Server.

I personally believe that the new Integration Services enhancements alone warrant upgrading to SQL Server 2012.

Columnstore Indexes To Speed ETL

SQL Server 2012 introduces columnstore indexes. Using the same in-memory VertiPaq engine that powers PowerPivot and Analysis Services Tabular, columnstore indexes can speed up dramatically SQL queries that aggregate large datasets. For a great introduction to columnstore indexes, see the video presentation, “Columnstore Indexes Unveiled” by Eric Hanson. I personally don’t see columnstore indexes as a replacement of Analysis Services because an analytical layer has much more to offer than just better performance. However, in a recent project we’ve found a great use of columnstore indexes to speed up ETL processes.

Issue: Perform an initial load of a snapshot fact table for inventory analysis from another fact table with one billion rows. For each day, extract some 200 million rows from the source fact table and group these rows into a resulting set of about 300,000 rows to load the snapshot fact table for that day. The initial estimates indicated that that the extraction query alone takes about 15 minutes when using a clustered index. And, that’s just for one day. Given this speed, we estimated the initial load could take weeks.

Solution: We upgraded to SQL Server 2012 and created a columnstore index on selected columns from the source fact table. We excluded high-cardinality columns that were not used by the extraction query to reduce the size of the index. Creating the index on the source table (1 billion rows) took about 10 minutes and this is very impressive. The disk footprint of the index was about 4GB. We ran the same extraction query and saw a five-fold performance improvement. This query, which would previously run for 15 minutes with a B-tree clustered index, would now finish in 3 minutes with a columnstore index.

When testing your queries with columnstore indexes, it is important to make sure that the query executes in Batch mode. As you can see in the screenshot below, the query uses the columnstore index and the execution mode is Batch. If it says Row, the query performance degrades significantly. Watch Eric Hanson’s presentation to understand why this happens and possible workarounds.

120811_0048_Columnstore1

When I did initial tests to test the columnstore index, I ran into a gotcha. I tested a simple “SELECT SUM(X) FROM TABLE” query to find that it executes in a Row mode and the query took about 2 minutes to finish. As usual, the first thing I try doesn’t work. As it turned out, currently a columnstore index doesn’t support batch mode with scalar aggregates. You need to rewrite the query with a GROUP BY as Eric Hanson explains this in more details in his blog, “Perform Scalar Aggregates and Still get the Benefit of Batch Processing”. This is rather unfortunate because every ad-hoc report starts with the end user dropping a measure and the report tool generating such queries.

When testing the performance gain, it’s useful to compare how the same query would perform without a columnstore index. Instead of having two tables or dropping the index, you could simply tell SQL Server to ignore the columnstore index, such as:

SELECT … FROM…WHERE…GROUP BY…

OPTION (IGNORE_NONCLUSTERED_COLUMNSTORE_INDEX)


To sum up, when you are pushing the envelope of traditional B-tree indexes and queries aggregate data, consider SQL Server 2012 columnstore indexes. The query optimizer would automatically favor a columnstore index when it makes sense to use it. Columnstore indexes require a read-only table but the cost of dropping and recreating them is not that high. Or, you could add them to speed up the initial DW load and drop them once the load completes.