Posts

What’s New in Office 2013 BI: Part 1 – Personal BI with Excel

As you probably know by now, Microsoft unveiled the Office 2013 Technology Preview. As the portal page says, “we’ve Taken Self-Service BI to the Next Level”. Indeed, this is where I believe we’ll see Office 2013 emerging as a leading tool on the market for self-service BI. Based on my experience, business users love Excel 2010 with PowerPivot because of its familiar environment and ease of use. However, the Excel visualization capabilities have been lacking. As familiar as they are, pivot table reports are getting somewhat outdated. This is why I put enhanced visualization options on my wish list. This all changes in Office 2013 where the question won’t be “Why we don’t have modern visualization options?” but “Which visualization option should I use?”

072312_0248_WhatsNewinO1

Microsoft decoupled Power View from SharePoint and added it to Excel to allow business users to create ad-hoc Power View reports that source data from the personal models that they create in Excel. Speaking of personal models, xVelocity (previously known as VertiPaq) integrates now natively in Excel to power any PivotTable and PivotChart report. Fellow MVPs have already covered some of the new BI features. Check Chris Webb’s Building a Simple BI Solution in Excel 2013 blog series and Thomas Ivarsson’s Power View in Excel 2013 blog series. In this blog, I’ll show you the Excel native integration with xVelocity and explain why you still need PowerPivot. Now that MSDN subscribers can set up a free VM on Windows Azure, I stood up a Virtual Machine that has SQL Server 2012 and Office 13. I plan to add SharePoint 2013 later on. A great solution for my demos!

Suppose you are a business analyst with Adventure Works and you’re tasked to analyze reseller sales data that is kept in the company’s data warehouse.

  1. Unlike Excel 2010, you don’t have to go to the PowerPivot Window to start the import process. Instead, you can use the Excel native import capabilities. Click on Data From Other Data Sources From SQL Server. Then, specify the server name and database.

072312_0248_WhatsNewinO2

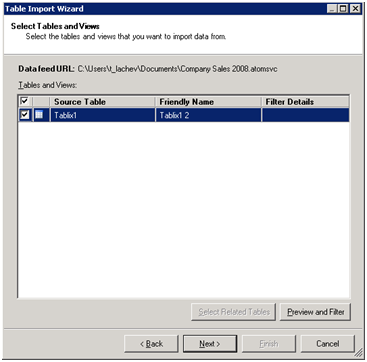
  1. In the Select Database and Table step, check the “Enable selection of multiple tables” checkbox so we can import multiple tables in one shot. Enabling importing of multiple tables would automatically put the data into the xVelocity store as Excel doesn’t natively support joining tables. Then, check FactResellerSales and click the Select Related Tables button to select all tables that are directly related to FactResellerSales if there are referential integrity constraints defined in the database.
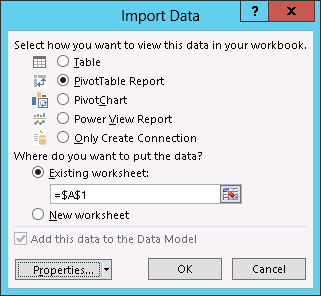
  2. In the Save Data Connection File and Finish step, enter the name of the file name and a friendly name of the connection and click Finish. The Import Data dialog box deserves more attention.

    072312_0248_WhatsNewinO3

    If you chose the first option, Excel will add new sheets with data, each corresponding to a database table. However, if you chose the other options, the data will be imported into the model but no sheets will be added to the workbook. This will be useful if you want to import a table with more than a million rows because Excel still has the limitation of having one million rows per sheet. As with the previous releases, the 64-bit of Excel is preferable if you want to pack lots of data in the xVelocity engine because it can access all the memory as opposed to 2 GB only.

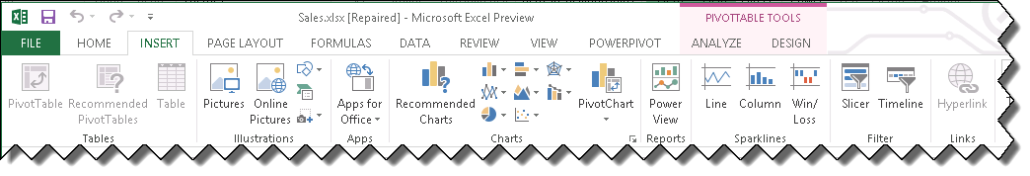
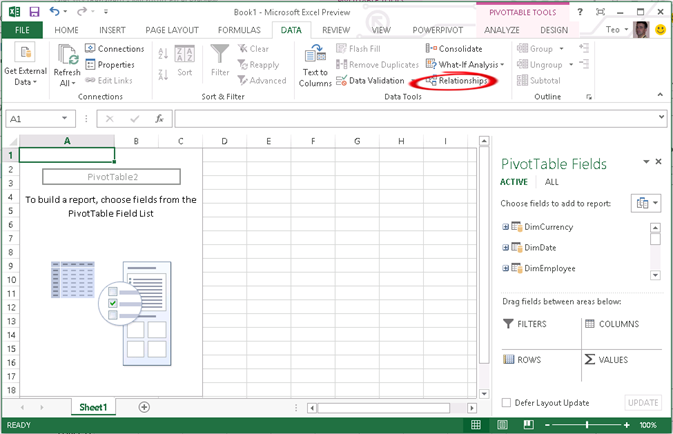
    Next, Excel imports the data and adds tables into the internal model, and then shows the tables in the field list (notice that the Excel field list supersedes the PowerPivot Field list). Also, notice that you can click the Relationship button to manage the table relationships as you can do now with PowerPivot for Excel. As you can see, some of the PowerPivot features moved to Excel. From the PivotTable field list ALL tab you can see any other table that exists in the workbook and use them in the pivot.

072312_0248_WhatsNewinO4

So, what about PowerPivot for Excel? The add-in is still there but not enabled by default. To enable it, click File ð Options, then click the Add-Ins tab. In the Manage drop-down, select COM Add-ins, and then check the Microsoft Office PowerPivot for Office 2013 add-in. This adds the PowerPivot menu to the Excel ribbon. From the PowerPivot menu, you can click the Manage button to launch the familiar PowerPivot for Excel window. No new PowerPivot features are added to Office 2013.

072312_0248_WhatsNewinO5

What can you do with PowerPivot that you can’t do with Excel 15? Here are some reasons to use the add-in:  

  • Add calculated columns to tables in the model
  • Add calculated measures
  • Change the metadata, e.g. rename tables and columns, format columns, change column data types
  • Hide tables and columns so they will not show in the field list
  • Use the diagram view to visualize the schema, manage relationships, create hierarchies
  • Using the PowerPivot advanced features, such as perspectives and Power View reporting features


OLAP PivotTable Extensions for Excel 2010

Kudos to Greg Galloway (SQL Server MVP) for upgrading his fantastic OLAP PivotTable Extensions for Excel 2010 add-in (now available in both x32 and x64). This add-in is one of the first third party tools I install on a new machine. Since the Excel team seems to be ignoring customer feedback for improving the Excel BI features, OLAP PivotTable provides what’s lacking, including:

  • Excellent search capabilities with Field List, Dimension Data and attribute options. By contrast, the Excel 2010 search is limited to searching within a hierarchy level only. This is pretty much useless with parent-child hierarchies. If I know what level the member is located, I don’t have to search, right?
  • Getting the MDX query – Excel refuses to expose the actual MDX.
  • Calculated members – Another feature that business users keep asking about but Excel doesn’t budge. The Calculations tab of the add-in lets you create calculated members. It will be great if this is more user-friendly. Ideally, the user should get the same Calculation Member dialog that’s included in Reporting Services.
  • Filtering of attribute members

071010_2228_OLAPPivotTa1

Product Release Galore

Microsoft announced release dates for SQL Server R2, SharePoint 2010, Office 2010, and Visual Studio 2010.

  • According to the Microsoft SQL Server Team Blog: SQL Server 2008 R2 (aka SQL 2010) will be listed on Microsoft’s May price list, and will be available by May 2010
  • According the Microsoft SharePoint Team Blog: SharePoint 2010 and Office 2010 will be officially launched on May 12, 2010 with an RTM date of April 2010
  • Visual Studio 2010’s release date was pushed to April 12, 2010 due to some performance issues according to Developer Division’s Marketing and Communications Manager Rob Caron’s blog.

2010 is sure a busy year for BI!

Reports as Data Feeds

Reporting Services SQL Server 2008 R2 features reports as Atom data feeds. This is accomplished with a new Atom Data Feed extension, as shown on this screenshot.

081409_0200_ReportsasDa1

This extension produces an atom service document (an *.atomsvc file). It lists at least one data feed for each data region in a report. In fact, some regions, such as tablix with column groups (cross-tab report layout) may generate multiple feeds.

At this point, you probably imagine subscribing to reports and receiving feeds in Outlook when report data is changed. Unfortunately, you won’t get very far doing so. As it turns out, atom data feeds are different from Atom feeds that most applications, such as IE and Outlooks understand directly. So even if you extract the Url out of the service document and display the .atom rendering of a report in IE, the browser won’t show useful information because it doesn’t understand that the data rows in the data feed are the important part.

So, how are report data feeds useful then? At this point, the design goal for reports as data feeds was to support Gemini – the new Excel 2010 extension that lets end users build in-memory cubes. Gemini can acquire data from variety of data sources, including data feeds and SSRS reports. Here is what it takes to subscribe to a report feed.

081409_0200_ReportsasDa2

  1. In the Gemini add-in, click the From Data Feed button.
  2. On the Connect to Data Feed step of the Table Import Wizard, browse to the data feed file you exported from the report. In this case, I am pointing to the atomsvc file exported from Company Sales 2008 report. On this step, you can set up advanced options, such as timeout, authentication, etc, and test the feed.

    081409_0200_ReportsasDa3

  3. On the Select Tables and Views step, select the regions on the report whose feeds you want to subscribe to. Since Company Sales 2008 has only one region, only one data feed is exposed. You can click the Preview button to preview the feed data. In the preview window, you can select which columns to import and set up a row filter (doesn’t seem to be working in the August CTP).

    081409_0200_ReportsasDa4Reporting Services, Analysis Services, Microsoft Office, SQL Server 2008 R2

  4. On the Import Summary step, preview the feed options and click Finish to import the data.

This imports the feed data into the Excel spreadsheet. From there, you can use Gemini to build the in-memory model and analyze the report data.

Relational Guide to Monitoring and Analyzing with Microsoft Office PerformancePoint Server 2007

As you know, business scorecards are the latest BI craze. Nick Barclay was kind enough to send me a copy of his new book Monitoring and Analyzing with Microsoft Office PerformancePoint Server 2007 by Rational Press which he co-authored with a co-worker and friend Adrian Downes. This is one of these relatively-small and very practical books which helps you hit the ground running quickly. As its name suggests, the book focuses only on the monitoring and analyzing piece of PerformancePoint which was previously known as Business Scorecard Manager. Nick and Adrian wrote another book, the Rational Guide to Planning with Microsoft Office PerformancePoint Server 2007, which covers the Biz# portion of the product.

I liked the author style and the practical examples included in the book. The authors show you how to build scorecards from a variety of data sources and deploy them to SharePoint or Reporting Services reports. I didn’t know that you can create a Visio strategy map and hook it to the scorecard. Too bad that the ProClarity stuff didn’t get integrated into BSM. I guess we have to wait for another release to get the cool decomposition tree when you click on a KPI. Until then, Visio strategy maps J

121607_0358_RelationalG1

Office 2007 RTM’ed

Microsoft Corp. today announced the completion of the 2007 Microsoft® Office system code and confirmed its release to manufacturing (RTM).

Office 2007 Business Intelligence Videos

Microsoft has released several cool Business Intelligence-related webcasts that target the forthcoming Office 2007. The webcasts are taken from the corresponding breakout session delivered at the Microsoft Office System Developers Conference 2006.