Posts

Troubleshooting the SharePoint Add-in for Reporting Services Part 2

Today, a co-worker declared a victory after struggling a few days to get Reporting Services 2008 SharePoint integration mode going on Windows Server 2008 (aka Longhorn). I helped of course J

  1. It all started with access denied error when attempting to deploy reports to SharePoint. Navigating to the WSS Central Admin Operations page would reveal however that the Reporting Services section is missing. After n-installs of the RS add-in we realized that something is not right.
    Take-home note: If the Reporting Services section is missing, the Reporting Services add-in failed to install irrespective of the fact that it didn’t report any errors. Bummer No 1.
    Wish No 1: The RS add-in should report errors to users ideally with recommendations.
  2. I asked him to troubleshoot the RS add-in installation following the steps in this blog.

    The most important line from the add-in log file was:

**********  User does not have permissions to add feature to site collection ********

So, the add-in installed the Report Server Integration Feature but it couldn’t activate it although my co-worker used the same account (his Windows account) to install the add-in and he had WSS Farms Administrators rights? Bummer No 2. Welcome to the SharePoint candy land where things are not what they appear to be.
Wish No 2: The farm administrator should have the right permissions to activate features or if he doesn’t have them for whatever reasons, the add-in should report this beforehand.

  1. Activate the feature manually:
    1. Go to SharePoint 3.0 Central Administration.
    2. Select Site Actions -> Site Settings
    3. Under the Site Collection Administration section click Site Collection Features
    4. Activate the Report Server Integration Feature in the list
  2. Run the RS add-in again. This time, no error messages in the add-in log file.

    Success!

    Disclaimer: The issues described above might be Windows Server 2008-specific (we have a tighter security model now, right) or at least I don’t recall having them on Windows Server 2003.

 

Speaking at TechEd 2009 USA

One of my TechEd 2009 session proposals got approved. The session is tentatively named Reporting Services 2008 Tips and Tricks, How-to, and Beyond. I am planning to cover solutions to common questions and challenges that span the three phases of the reporting lifecycle: authoring, management and delivery. I hope you can attend my session If you planning to attend TechEd 2009 USA. Shoot me a note if you want me to cover something in particular. See you in LA!

Hacking MDX Query Designer Parameters

[View:/CS/cfs-file.ashx/__key/CommunityServer.Blogs.Components.WeblogFiles/blog/simpleparameters.zip]Continuing our intrepid journey in the land of SSRS-SSAS integration, after we’ve figured out how to retrieve the cube metadata, we are ready to tackle another unchartered territory: query parameters.

Issue: You need to parameterize the MDX query by a measure or a simple parameter. Take for example the following report (attached).

022609_0224_HackingMDXQ1

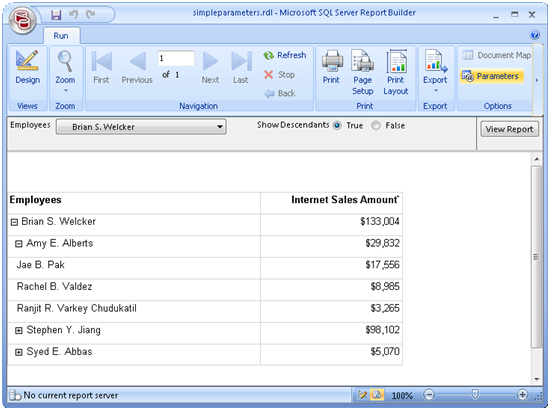
This report shows the Internet Sales Amount measure broken down by the Employees parent-child hierarchy. What’s more interesting is the Show Descendants parameter. It lets you filter the report for a single employee (Show Descendants = False) or the descendants of the selected employee including the selected employee (Show Descendants = True). So, what’s the issue? You can whip out such a report in no time if you source data from a relational database. However, the MDX Query Designer insists that the parameter is resolved to a single dimension member or a set of dimension members. Apparently, simple parameters or parameterizing by measures were considered uncommon scenarios. So, we need a sleek hack.

Solution: Luckily, there is a way to gain more control over the MDX query parameters but the design mode (the one that lets you drag and drop stuff) won’t cut it. So, it may make sense to author the report query in design mode as much as you can before you jump into the cold waters of MDX query mode because there is no going back to drag and drop, sorry.

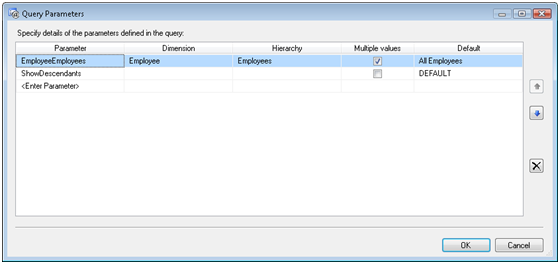
  1. To start with, you need to define a query parameter for the ShowDescendants parameter. Switch to MDX mode and click the Query Parameters toolbar button (enabled only in MDX mode).
  2. Add a new ShowDescendants “hanging” parameter that doesn’t reference any dimension. Make sure that the query parameter name matches the report parameter name. Otherwise, the MDX Query Designer will treat the parameter as a new parameter and it won’t associate it to the existing ShowDescendants report parameter. Note that the parameter name is case-sensitive.

022609_0224_HackingMDXQ2

  1. Leave the Dimension and Hierarchy columns empty. Luckily, they are not required in MDX mode. Either type in a measure name, such as [Measures].[Sales Summary], or enter DEFAULT in the Default column. In the latter case, the default cube measure will be used when you test the query in the MDX Query Designer. See this blog by Chris Webb for ideas about how to speed up the default measure if needed. Click OK.
  2. Back to the query, change it as follows:

SELECT NON EMPTY { [Measures].[Reseller Tax Amount] } ON COLUMNS, NON EMPTY

IIF(@ShowDescendants=False, StrToMember(@EmployeeEmployees), DESCENDANTS(StrToMember(@EmployeeEmployees)))

DIMENSION PROPERTIES MEMBER_CAPTION, MEMBER_UNIQUE_NAME, PARENT_UNIQUE_NAME, LEVEL_NUMBER ON ROWS FROM [Adventure Works] CELL PROPERTIES VALUE, BACK_COLOR, FORE_COLOR, FORMATTED_VALUE, FORMAT_STRING, FONT_NAME, FONT_SIZE, FONT_FLAGS 

These changes are specific to the report requirements. In our case, the IIF expression checks the value of the ShowDescendants parameter. If the user has selected the False option, the query brings only the selected employee on rows. Otherwise, we use the Descendants function to bring the descendants of the selected employee.

Looks hacky? Join me and make a wish on connect.microsoft.com to improve the SSRS-SSAS integration. Don’t be surprised if you are not active that the MDX Query Designer will continue to sneak from one version to another unchanged.

Report Builder 2.0 ClickOnce

One important change that Service Pack 1 for SQL Server 2008 (public CTP available here) will bring is ClickOnce deployment of Report Builder 2.0. By default, however, Report Manager or SharePoint (if you have SSRS installed in SharePoint integration mode) still point to Report Builder 1.0. Here is how to reconfigure SSRS to launch Report Builder 2.0 instead. The following procedure assumes SharePoint integration mode but the steps are similar if SSRS is running in native mode.

CAUTION   Steps 1 and 2 below to copy folders are for the CTP bits of SQL Server 2008 SP1 only because the CTP build doesn’t support RB 2.0 ClickOnce in SharePoint integration mode. SQL Server 2008 SP1 RTM will include an installer to make the appropriate folder changes automatically. Therefore, DO NOT manually copy the folder content with the final bits or undo your changes before you install SP1 RTM so the installer doesn’t fail.

  1. SharePoint Integration Mode Only. Back up the content of the C:\Program Files\Common Files\Microsoft Shared\Web Server Extensions\12\ISAPI\ReportBuilder folder. This step is not needed with native mode.
  2. SharePoint Integration Mode Only. Copy all files from the C:\Program Files\Microsoft SQL Server\MSRS10.MSSQLSERVER\Reporting Services\ReportServer\ReportBuilder folder to the C:\Program Files\Common Files\Microsoft Shared\Web Server Extensions\12\ISAPI\ReportBuilder folder. This step is not needed with native mode.
  3. SharePoint Integration Mode Only. If you install SQL Server 2008 SP1 this will provide an update for native mode only.  In order to get Report Builder ClickOnce for SharePoint integration mode working, you need to download the RB 2.0 ClickOnce update for the RS SharePoint add-in from the feature pack page.  This is necessary because the ClickOnce bits must reside on the SharePoint server. As of the time of this writing, the latest add-in is April 2009 which you can download from here. Install rsSharePoint.msi (or rsSharePoint_x64.msi for x64) to update the SharePoint add-in. Then install RB2ClickOnce.msi which copies the Report Builder 2.0 ClickOnce files to the SharePoint site.Note (7/15/09): There is a known issue that RB2ClickOnce.msi fails to install on x64 environment. Microsoft should fix this in Cummulative Update 3 for SQL Server 2008 Service Pack 1. Meanwhile, if you have a report server running in SharePoint integration mode on x64, manually copy the Report Builder 2.0 files by following steps 1 and 2.
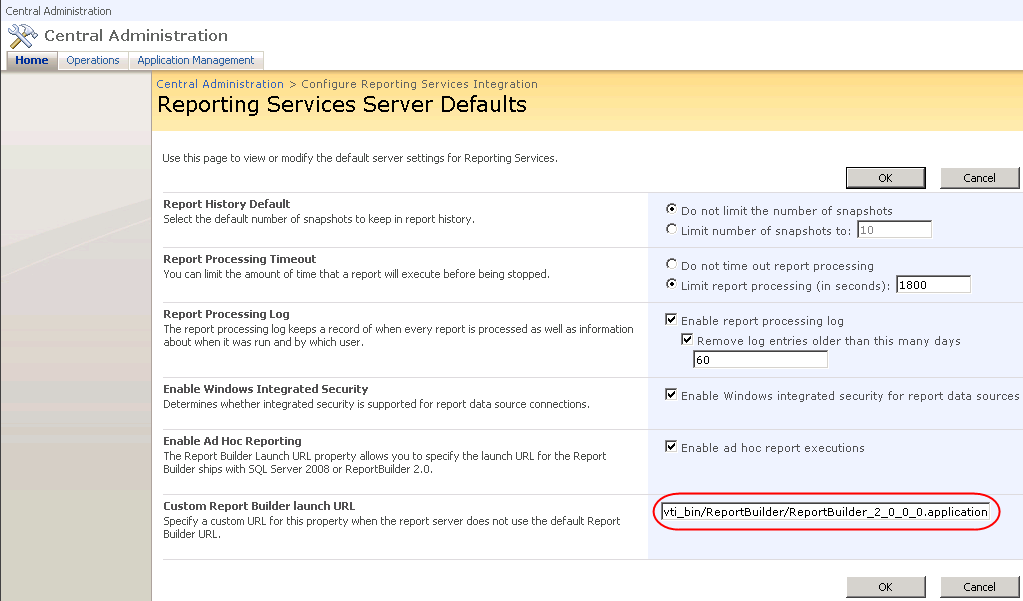
  4. SharePoint Integration Mode Only. Open WSS Central Administration. Click the Application Management tab. Click the Set Server Defaults link found under the Reporting Services section.

022509_0300_rbclickonce20

5. Enter the URL address to the ReportBuilder_2._0_0_0.application file. In SharePoint mode, assuming you followed steps 1-2, the URL address will be:
/_vti_bin/ReportBuilder/ReportBuilder_2_0_0_0.application

For a report server configured in native mode, go to Report Manager, click the Site Settings menu link and enter the following to the Custom Report Builder launch URL setting:

/ReportBuilder/ReportBuilder_2_0_0_0.application

At this point, SSRS is reconfigured to launch Report Builder 2.0 instead of Report Builder 1.0. From the end user perspective, the user would launch RB 2.0 just like they used to launch RB1.0, that is, click New->Report Builder Report in SharePoint or click the Report Builder button in Report Manager. The first time the user does this, the Report Builder 2.0 bits (almost 50 MB) will get downloaded and installed in the ClickOnce local application cache, which is a hidden directory under Local Settings for the current user. The ClickOnce application cache will not be cleared when the user clears the browser cache. Subsequent requests will use the local copy.

UPDATE Now that SQL Server 2008 SP1 is released, it includes a readme file with steps how to configure and troubleshoot Report Builder 2.0 ClickOnce in SharePoint integration mode.

Reporting Services Tracer

To make a humble contribution to open source, I’ve just uploaded the Reporting Services Tracer (RsTracer) project to CodePlex. RsTracer helps you trace the URL and SOAP traffic to/from a report server. Given the sheer number of Web methods supported by Reporting Services, you might find yourself asking which web method should you choose for the management task at hand and how should you call it? At the same time, it is likely that Report Manager or Management Studio already supports some aspect of the management feature you want to implement.

Wouldn’t it be nice to be able to peek under the hood and see what APIs Report Manager or a custom application calls? This is exactly what the RsTracer sample was designed to handle. RsTracer intercepts the server calls and outputs them to a trace listener, such as the Microsoft DebugView for Windows. RsTracer helps you see the APIs that a Reporting Services client invokes and what arguments it passes to each interface. It also intercepts the server response. Armed with this information, you can easily reproduce the same feature in your custom management application. You can use RsTracer with SSRS 2000, 2005, and 2008.

Enjoy!

Retrieving Cube Metadata in Reports

An interesting question popped up on the discussion list the other day about how to retrieve a list of the cube measures so the report author can display them in a report parameter.

Solution 1: If you just need a list of measures but not the measure metadata, such as display folder, etc., you can use the following (not trivial, ok hacky) query, which I borrowed from my esteemed colleague MVP and MDX guru Chris Webb:

WITH SET MYSET AS HEAD([Date].[Date].[Date].MEMBERS, COUNT(MEASURES.ALLMEMBERS)-1)

MEMBER MEASURES.MeasureUniqueName AS  MEASURES.ALLMEMBERS.ITEM(RANK([Date].[Date].CURRENTMEMBER, MYSET)-1).UNIQUENAME

MEMBER MEASURES.MeasureDisplayName AS MEASURES.ALLMEMBERS.ITEM(RANK([Date].[Date].CURRENTMEMBER, MYSET)-1).NAME

SELECT {MEASURES.MeasureUniqueName, MEASURES.MeasureDisplayName} ON 0,

MYSET ON 1

FROM [Adventure Works]


Solution 2: This approach is especially useful if you need the measure properties. In this case, you must use the OLE DB Provider for Analysis Services instead of the SSRS Analysis Services Provider (the one that gives you the nice MDX Designer). This approach uses the MDSCHEMA_MEASURES rowset, which is one of the built-in SSAS schema rowsets. Darren Gosbell provides a great overview of the SSAS rowsets here and Vidas Matelis gives more insights here. Thanks to the schema rowsets, getting a list of measures can’t simpler.

SELECT * from $System.MDSCHEMA_MEASURES

The user will require Read Definition rights (on Role Properties General tab, check Read Definition) to obtain the metadata. If the user doesn’t have this right, an empty dataset will be returned.

There are of course additional schema rowsets, such as MDSCHEMA_KPIS if you want to get a list of all KPIs or DBSCHEMA_TABLES in case you want to discover the cube dimensions and measure groups. BOL provides a full list here. Aren’t SSAS schema rowsets cool?


Reporting Services 2008 Dashboard Goes Live

Thanks to the Robert Bruckner’s blog, I’ve learned that Microsoft has published the Reporting Services 2008 Information Aggregator. It is a cool dashboard page that aggregates a variety of resources related to Reporting Services, such as training content, white papers, blogs and more. I’m proud to be featured as an MVP J The page also includes to my most recent books and training videos I’ve authored.

Kudos go to the Reporting Services user education team who worked hard to implement this page. Check out the SSRS aggregator and add it to your favorites.

SQL Server 2005 Service Pack 3 is Out

Yesterday, Microsoft released SQL Server 2005 Service Pack 3. Reporting Services Report Builder added support with Teradata. Note that some manual configuration is required to turn things ‘on’ as well as you need to install the .Net provider from Teradata.

Dimensionalizing Pivoted Measures

Issue

You have a table with pivoted measures, such as:

121608_0043_Dimensional1

Use the following statement to create and populate the table:

CREATE
TABLE pvt
(VendorID int, DateID int, MaturityAmount1 int, MaturityAmount2 int,

MaturityAmount3 int, RepricingAmount1 int, RepricingAmount2 int, RepricingAmount3 int);

GO

INSERT
INTO pvt VALUES (1,1,4,3,5,4,4, 100);

INSERT
INTO pvt VALUES (2,1,4,1,5,5,5, 100);

INSERT
INTO pvt VALUES (1,2,4,3,5,4,4, 200);

INSERT
INTO pvt VALUES (2,2,4,1,5,5,5, 200);

INSERT
INTO pvt VALUES (3,1,4,3,5,4,4, 300);

INSERT
INTO pvt VALUES (3,2,4,3,5,4,4, 400);

INSERT
INTO pvt VALUES (3,3,4,3,5,4,4, 100);

INSERT
INTO pvt VALUES (4,1,4,2,5,5,4, 100);

INSERT
INTO pvt VALUES (5,1,5,1,5,5,5, 200);

GO

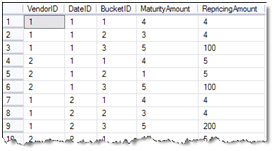
Let’s say you need a way to unpivot the results in the following format which is more suitable for OLAP:

121608_0043_Dimensional2

In this way, you eliminate the repeating measure columns with a single column. Here, the BucketID column is introduced so you could join the results to a dimension to let the user cross-tab the results on columns.

Solution

Usually, ETL processes would take care of transforming data in format suitable for analysis especially with large data volumes. However, with smaller fact tables and an OLAP layer directly on top of the operational database, such as having SQL views directly on top of the source database, you may need an ad-hoc approach to unpivot the results. Assuming you are fortunate to have SQL Server 2005 or above, you can use the SQL Server UNPIVOT function to unpivot on multiple columns. The following query does the trick:

SELECT VendorID, DateID,
CAST(REPLACE(Maturity,
‘MaturityAmount’,
)
as
int)
as BucketID,

MaturityAmount, RepricingAmount

FROM


(SELECT VendorID, DateID, MaturityAmount1, MaturityAmount2, MaturityAmount3,

RepricingAmount1, RepricingAmount2, RepricingAmount3 FROM pvt) p

UNPIVOT


(MaturityAmount FOR Maturity IN
(MaturityAmount1, MaturityAmount2, MaturityAmount3))
AS UnPivotedMaturity

UNPIVOT


(RepricingAmount FOR Repricing IN
(RepricingAmount1, RepricingAmount2, RepricingAmount3))
AS UnPivotedRepricing

WHERE
REPLACE(Maturity,
‘Maturity’,
)
=
REPLACE(Repricing,
‘Repricing’,
)

Notice that a WHERE clause is needed to join the two unpivoted sets so you don’t end up with a Cartesian set. The net result is that the number of rows in the unpivoted dataset is:

Number of Rows in Pivoted (original) Table * Number of Repeated Columns

So, in our case, the dataset will have 9 * 3 = 27 rows.

Troubleshooting the SharePoint Add-in for Reporting Services

A common issue when setting up Reporting Services integration with SharePoint is that the SharePoint add-in is not installed properly although the setup program doesn’t indicate any issues. More than likely, the culprit is that the person who installed the add-in is not SharePoint Web farm administrator and Site Collection administrator.

As a first stop for troubleshooting SharePoint integration issues, you should examine the add-in log after the add-in setup completes to verify if it was installed successfully. You’ll find the log file (RS_SP_<N>.log) in your temp folder, such as \Documents and Settings\<login>\Local Settings\Temp. Specifically, check that all activation tasks have completed successfully and that there are no errors. If all is well, the log files should look as follows:

User: <userid>

Installing Report Server feature.

Calling copyappbincontents command.

copyappbincontents command completed successfully.

Adding Report Server feature to farm.

Installed Report Server feature.

Activating Report Server feature to root level site collections.

Activating feature in web app ‘SharePoint – 80’

Activating feature to root site collection: http://<server>

Activated feature for root site collection: http://<server>

Activating Report Server feature in all admin site collections.

Activating feature in web app ”

Activating feature to root site collection: http://<server>:35000

Feature already activated in site collection http://<server>:35000