Posts

SQL Server 2012 Semantic Search

Suppose your company has a web application that allows customers to enter comments, such as to provide feedback about their product experience. How do you derive knowledge from these comments? Perhaps, customers are complaining a lot about a particular product. Or, they are raving about your service. Enter semantic search – a new feature in SQL Server 2012.

Building upon full text search, semantic search allows you to search not only for words, but also for the meaning (semantics) of these works. Mark Tabladillo, Ph.D., gave us great presentation at our Atlanta BI January meeting. He demoed how semantic search can be used to find the most common phrases in a document and how to find similar documents from a given search criteria.

Besides external documents, you can apply semantic search to text data already stored in a database, such as a text-based Comments field. Again, this is possible because semantic search builds upon the full-text search capabilities of SQL Server. So, any column that supports full-text search can be enhanced with semantic search.

Going back to my scenario, here is what it takes to configure a text field for semantic search:

  1. When you use semantic search, SQL Server performs statistical analysis of the words in the column contents. This analysis requires base data that is provided as a SQL Server database. Because the database is not installed by default, as a perquisite of using semantic search, you need to run the semantic database installer. The installer can be found on the SQL Server setup disk in the following folders:
    For x86, the setup is \x86\Setup\SemanticLanguageDatabase.msi
    For x64, the setup is \x64\Setup\SemanticLanguageDatabase.msi
  2. The setup simply extracts the MDF and LDF files of the semantic database to a folder that you specify during the installation. Next, simply attach the semantics database to your SQL Server 2012 instance as you would with any other database.
  3. The next step is another step that you need to perform only once for each SQL Server instance. Register the semantics database using this command:

EXEC sp_fulltext_semantic_register_language_statistics_db @dbname = ‘SemanticsDB’

4.    Next, create a full-text index using Statistical_Semantics option which is new with SQL Server 2012.

CREATE FULLTEXT INDEX ON [Production].[ProductReview]

(

[Comments] LANGUAGE [English] Statistical_Semantics

)

KEY INDEX [PK_ProductReview_ProductReviewID] ON ([AW2008FullTextCatalog], FILEGROUP [PRIMARY])

WITH (CHANGE_TRACKING = AUTO, STOPLIST = SYSTEM)

This command creates a semantic-enabled full-text index on the Comments column in the Production.ProductReview table on the AW2008FullTextCatalog full text catalog. The AW2008FullTextCatalog text catalog is included with the AdventureWorks2012 database. The CHANGE_TRACKING = AUTO clause instructs SQL Server to auto-update the index, and STOPLIST = SYSTEM specifies that the default full-text system STOPLIST should be used to parse words.

5.   Now that you’ve done the ground work, you can perform the semantic search. For example, the following query returns the most frequent words for each document:

SELECT TOP(5) KEYP_TBL.document_key, KEYP_TBL.keyphrase, KEYP_TBL.score

FROM SEMANTICKEYPHRASETABLE

(

[Production].[ProductReview],

    [Comments]

) AS KEYP_TBL

ORDER BY KEYP_TBL.score DESC

021113_0015_SQLServer201

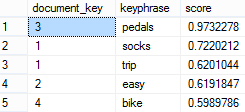
Note that the document_key matches the ProductReviewID column (primary key) of the [Production].[ProductReview] table allowing you to match the semantic search results to the document. For example, “socks” and “trip” were found in the row with the primary key of 1 whose Comments column contains the following text:

“I can’t believe I’m singing the praises of a pair of socks, but I just came back from a grueling 3-day ride and these socks really helped make the trip a blast. They’re lightweight yet really cushioned my feet all day. The reinforced toe is nearly bullet-proof and I didn’t experience any problems with rubbing or blisters like I have with other brands. I know it sounds silly, but it’s always the little stuff (like comfortable feet) that makes or breaks a long trip. I won’t go on another trip without them!”

You can feed these results to a data mining model if you want to learn which phrases customers tend to use together similar to identifying what products customers tend to purchase together (market basket analysis). “Together” here means within a specific document.

What if you want to get the most popular phrases across all comments? I think the following query should help although there might be a better way. The query groups phrases and sorts them in a descending order by the average score.
SELECT TOP(5) KEYP_TBL.keyphrase, AVG(score) AS Score

FROM SEMANTICKEYPHRASETABLE

(

[Production].[ProductReview],

[Comments]

) AS KEYP_TBL

GROUP BY KEYP_TBL.keyphrase

ORDER BY AVG(KEYP_TBL.score) DESC;
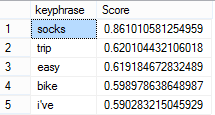
 

021113_0015_SQLServer202

Book Review “Microsoft SQL Server 2012 Analysis Services – The BISM Tabular Model”

I’ve recently had the pleasure to read the book “Microsoft SQL Server 2012 Analysis Services – The BISM Tabular Model” by Marco Russo, Alberto Ferrari, and Chris Webb. The authors don’t need an introduction and their names should be familiar to any BI practitioner. They are all well-known experts and fellow SQL Server MVPs who got together again to write another bestseller after their previous work “Expert Cube Development with Microsoft SQL Server 2008 Analysis Services”. The latest book was published about five months after my book “Applied Microsoft SQL Server 2012 Analysis Services: Tabular Modeling”. Although both books are on the same topic, we didn’t exchange notes when starting on the book projects. In fact, I was well into writing mine when I learned on the SSAS insider’s discussion list about the trio’s new project. Naturally, you might think that the books compete with each other but after reading Microsoft SQL Server 2012 Analysis Services – The BISM Tabular Model” I agree with Marco and Chris that the books actually complement each other pretty well.

A central theme of my book is the continuum of Self-service, Team, and Organizational BI. I felt that it is very important to show how Tabular addresses the needs of both business users and BI pros. Indeed, the Tabular journey can start very unassuming, perhaps with a business user creating a simple personal model, gains popularity and evolves to a deployed model shared by teammates, and finally to a corporate model that is provisioned and sanctioned by IT. Because of this, the first part of the book covers PowerPivot for Excel, the second covers PowerPivot for SharePoint, and the third part covers Analysis Services Tabular. Since my book naturally targets different reader audiences (business users, power BI users, and BI pros), I felt that it was imperative to lower the learning curve as much as possible, such as providing step-by-step instructions for the exercises and video tutorials. Writing a book that targets such a broad base is not easy. To make sure that the book will be well accepted, I had readers who represented each of these groups review the manuscript and provide feedback.

On the other hand, Microsoft SQL Server 2012 Analysis Services – The BISM Tabular Model focuses on the professional side of Analysis Services Tabular and targets mainly BI pros. More than half of the book is devoted on DAX and you’ll be hard pressed to find a better coverage on this topic (a note to myself that DAX deserves more attention if I ever write a revision). Besides DAX, Microsoft SQL Server 2012 Analysis Services – The BISM Tabular Model covers equally well other aspects of Tabular and the author’s real life experience shows through. My favorite chapters are Chapter 11 “Data Modeling in Tabular” and Chapter 12 “Using Advanced Tabular Relationships”.

All in all, any serious BI pro willing to learn Tabular should have this book on the shelf… I hope next to mine.

SharePoint 2013 and SQL Server 2012

As I mentioned before, Microsoft released SharePoint 2013 and Office 2013 and the bits are now available on MSDN Subscriber Downloads. I am sure you are eager to try the new BI features. One thing that you need to be aware of though is that you need SQL Server 2012 Service Pack 1 in order to integrate the BI features (PowerPivot for SharePoint and SSRS) with SharePoint 2013. If you run the RTM version of SQL Server 2012 setup, you won’t get too far because it will fail the installation rule that SharePoint 2010 is required. That’s because the setup doesn’t know anything about SharePoint 2013 and the latest release includes major architectural changes.

Then the logical question is where is SQL Server 2012 SP1 now that is a prerequisite for SharePoint 2013 BI? As far as I know there isn’t a confirmed ship date yet but it should arrive soon. I’d suspect Microsoft to announce it at PASS.

SQL Server 2012 CU3 Available

Microsoft just released Cumulative Update 3 of SQL Server 2012. Among other bug fixes, this CU includes critical fixes for columnstore indexes that we’ve reported to Microsoft. If you use SQL Server 2012 columnstore, you must install CU3. The important columnstore-related fixes are:

http://support.microsoft.com/kb/2703193

http://support.microsoft.com/kb/2708786

Finding Reporting Services Service in SharePoint

SharePoint is a like an ocean – the further you go, the deeper it gets

Ancient proverb 

Scenario: Configure SQL Server 2012 Reporting Services on a multi-server SharePoint farm with the following topology:

WEB1 – Web front-end Server 1

WEB2 – Web front-end Server 2

APP1 – Application server 1 that hosts the Central Administration site

APP2 – Needs SSRS 2012

APP2 – Needs SSRS 2012

Issue: I couldn’t find the SQL Server Reporting Services Service Application option when I expanded the New button in Central Administration ð Manage Service Applications

Resolution: Although the SQL Server 2012 Reporting Services service and Reporting Services Add-in were installed on APP2 and APP3, the SQL Server Reporting Services service wasn’t registered at a farm level. As a result, I couldn’t find the SQL Server Reporting Services Service in Central Admin -> Manage Services on Server on none of the application servers. As it turned out, the SSRS service must be also registered on the application server hosting Central Administration (APP1 in my case) as Prash Shirolkar explains in his blog:

  1. Remote in to APP1.
  2. Install the Reporting Services add-in to get the SSRS PowerShell cmdlets. In my case, I installed only the add-in and not the Reporting Services service since I didn’t want it on APP1.
  3. Run the SharePoint 2010 PowerShell as admin and execute the three commands in the Install and Start the Reporting Services SharePoint Service in the Install Reporting Services SharePoint Mode as a Single Server Farm document:
    1. Install-SPRSService
    2. Install-SPRSServiceProxy
    3. get-spserviceinstance -all |where {$_.TypeName -like “SQL Server Reporting*”} | Start-SPServiceInstance

Interestingly, the first two commands don’t echo any output. The third command, however, should show you a message that the SSRS service has been provisioned. Now, you can go to Central Administration ð Manage Services on Server and you should be able to find the SQL Server Reporting Services Service. More importantly, you should be able to go to Central Administration ð Manage Service Applications, expand the New button and then click SQL Server Reporting Services Service Application to finalize the Reporting Services setup.

Possible alternative resolution path

Although I haven’t tried it because the client woudn’t allow farm configuration changes, another potential resolution path could be to temporarily switch the application server that hosts the Central Administration utility to one of the SSRS application server (APP2 or APP3) as explained in the blog post, “How to change Central Admin Host in SharePoint 2010” by Kirk Barrett. Then, you can register the SSSRS service on that server by executing the steps in item 3 above. Finally, switch back the Central Administration host server to the original server (APP1).

Subscription and Alerts Issues with Analysis Services in SQL Server 2012

As you probably now, Reporting Services doesn’t allow you to create subscriptions with data sources that use Windows security because subsbscriptions are run in unattended mode. Moving to SQL Server 2012, we’ll add Data Alerts to the list. This presents an issue if you use Analysis Services which only supports Windows security. The only option is to use Stored Credentials with the “Use as Windows credentials” checkbox checked. You won’t able to pass the user identity by checking “Set execution context to this account”. As with previous releases, “Set execution context to this account” works with the SQL Server data but it doesn’t work with the Analysis Services provider.

I raised this issue to Microsoft and I posted a bug report. The issue is under investigation but it’s unlikely to get fixed before SQL Server 2012 ships. Please vote!

Using the Hash Group Hint to Speed up ColumnStore Indexes

As I mentioned in my blog post on this subject, I’ve found a good use of SQL Server 2012 columnstore indexes to speed up significantly ETL processes that need to aggregate large datasets. But we run into a snag, which got promoted to a bug by Microsoft Support Services. Under some conditions, SQL Server would create a plan that uses a “stream aggregate” operator instead of the more efficient hash match aggregate. This is illustrated by the following plans.

This plan uses the stream aggregate and the query is much slower. If you hover on the Sort predicate, you will see a warning that the sort will spill data to tempdb.

6266.p1.png-550x0

By contrast, this plan uses the Hash Match predicate and the query is about three times faster.

1464.p2.png-550x0

As I mentioned, this appears to be a bug with SQL Server 2012, which might not get fixed in RTM. Meanwhile, force your queries to use the HASH GROUP query hint to force SQL Server to use a hash match with columnstore indexes.

GROUP BY              Organization_Id,

                      Item_Profile_Id,

            …

OPTION (HASH GROUP)

Columnstore Indexes To Speed ETL

SQL Server 2012 introduces columnstore indexes. Using the same in-memory VertiPaq engine that powers PowerPivot and Analysis Services Tabular, columnstore indexes can speed up dramatically SQL queries that aggregate large datasets. For a great introduction to columnstore indexes, see the video presentation, “Columnstore Indexes Unveiled” by Eric Hanson. I personally don’t see columnstore indexes as a replacement of Analysis Services because an analytical layer has much more to offer than just better performance. However, in a recent project we’ve found a great use of columnstore indexes to speed up ETL processes.

Issue: Perform an initial load of a snapshot fact table for inventory analysis from another fact table with one billion rows. For each day, extract some 200 million rows from the source fact table and group these rows into a resulting set of about 300,000 rows to load the snapshot fact table for that day. The initial estimates indicated that that the extraction query alone takes about 15 minutes when using a clustered index. And, that’s just for one day. Given this speed, we estimated the initial load could take weeks.

Solution: We upgraded to SQL Server 2012 and created a columnstore index on selected columns from the source fact table. We excluded high-cardinality columns that were not used by the extraction query to reduce the size of the index. Creating the index on the source table (1 billion rows) took about 10 minutes and this is very impressive. The disk footprint of the index was about 4GB. We ran the same extraction query and saw a five-fold performance improvement. This query, which would previously run for 15 minutes with a B-tree clustered index, would now finish in 3 minutes with a columnstore index.

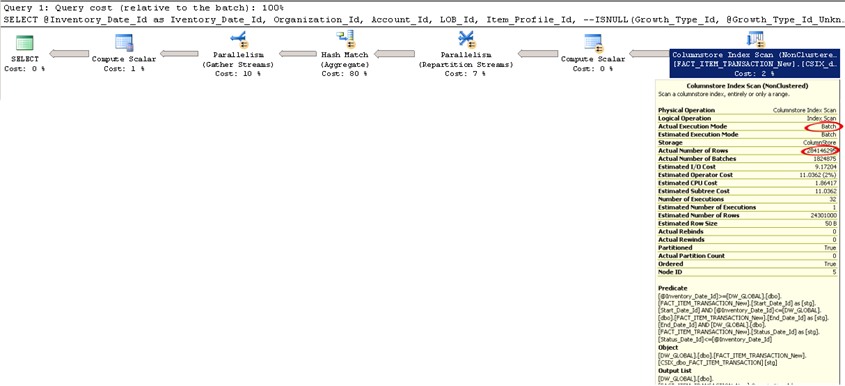
When testing your queries with columnstore indexes, it is important to make sure that the query executes in Batch mode. As you can see in the screenshot below, the query uses the columnstore index and the execution mode is Batch. If it says Row, the query performance degrades significantly. Watch Eric Hanson’s presentation to understand why this happens and possible workarounds.

120811_0048_Columnstore1

When I did initial tests to test the columnstore index, I ran into a gotcha. I tested a simple “SELECT SUM(X) FROM TABLE” query to find that it executes in a Row mode and the query took about 2 minutes to finish. As usual, the first thing I try doesn’t work. As it turned out, currently a columnstore index doesn’t support batch mode with scalar aggregates. You need to rewrite the query with a GROUP BY as Eric Hanson explains this in more details in his blog, “Perform Scalar Aggregates and Still get the Benefit of Batch Processing”. This is rather unfortunate because every ad-hoc report starts with the end user dropping a measure and the report tool generating such queries.

When testing the performance gain, it’s useful to compare how the same query would perform without a columnstore index. Instead of having two tables or dropping the index, you could simply tell SQL Server to ignore the columnstore index, such as:

SELECT … FROM…WHERE…GROUP BY…

OPTION (IGNORE_NONCLUSTERED_COLUMNSTORE_INDEX)


To sum up, when you are pushing the envelope of traditional B-tree indexes and queries aggregate data, consider SQL Server 2012 columnstore indexes. The query optimizer would automatically favor a columnstore index when it makes sense to use it. Columnstore indexes require a read-only table but the cost of dropping and recreating them is not that high. Or, you could add them to speed up the initial DW load and drop them once the load completes.


What’s New in Power View RC0

I was just about to write a blog about the new features in the Release Candidate (RC) build of Power View and I saw that Robert had written a great blog already. It’s great to see the product coming along so nicely. Can’t wait to be able to use multidimensional cubes as data sources!

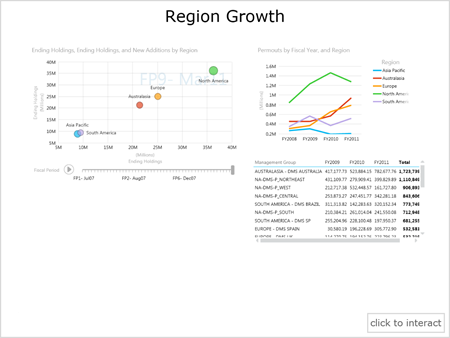
One feature that stirred a lot of excitement and deserves more attention is Power View export to PowerPoint. When you export a report to PowerPoint, initially you get static slides that show images of the report pages.

112311_0129_WhatsNewinP1

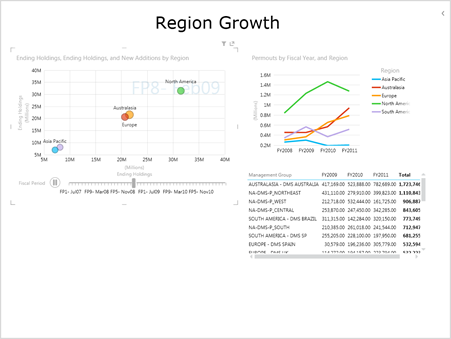
Don’t be fool however as you can click the Click to Interact button to render the report live. The interactive mode preserves all report interactive features. For example, in the screenshot below I am playing the scatter chart animation.

112311_0129_WhatsNewinP2

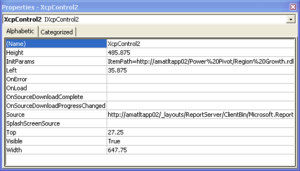
Behind the scenes, the interactive mode uses a Silverlight alternative hosting control (right-click the object on the slice and click View Code) that points to the deployed report on the SharePoint server. Therefore, a live connection and permissions to SharePoint are required to preview the report inside PowerPoint.

112311_0129_WhatsNewinP3

UPDATE 11/29/11

As explained in the SQL Server 2012 RC0 release notes, the pre-release bits of Silverlight 5 are not available in 64-bit. The RTM release will include a 64-bit installer and it looks like it be available pretty soon. Meanwhile, trying to interact with a Power View report exported to PowerPoint 64-bit wil fail with the error “Some controls on this presentation can’t be activated. They might not be registered on this computer.”


SQL Server 2012 RC is Here

The public release of Microsoft SQL Server
2012 RC0 is now available.