The New Kid on the Block (aka Stand-alone Report Designer)
The need for a stand-alone Report Designer is real. True, developers, including myself, enjoyed the VS.NET Report Designer. But novice users were overwhelmed with the complexity of the VS.NET IDE environment. In addition, not all IT shops rejoiced over the idea to install VS.NET or BIDS just to author reports. Enters the SSRS 2008 stand-alone report designer.

As its name suggests, you run this designer completely outside VS.NET. In fact, in CTP4, VS.NET has not been yet integrated with the new designer (it still uses the RS 2005 designer). Therefore, to get the new RDL enhancements in CTP 4, such as tablix, you need to use the stand-alone report designer.
Note that stand-alone doesn’t mean embeddable. While a future release make this possible, it is unlikely that you will be able to embed the SSRS 2008 designer in custom .NET application.
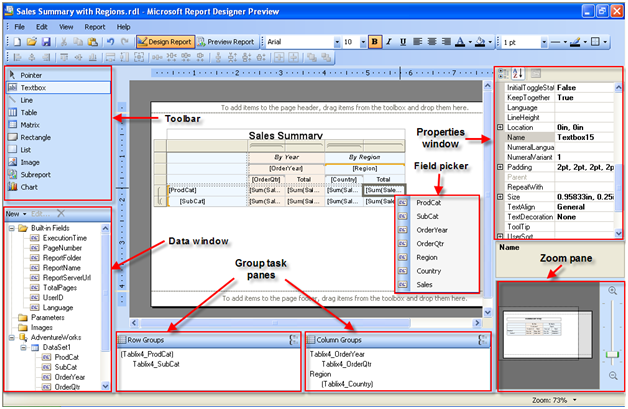
You launch the stand-alone report designer from the Report Designer Preview link in the Reporting Services program group. As you would immediately see, its UI resembles the Report Builder UI. There are a few welcome enhancements. First, there is a new Data Window which shows the Build-in Fields, Parameters, Images, and Datasets all in one place. Next, the Group Task Panes shows conveniently the row and column groups and minimizes the steps required to set up a new group. With SSRS 2005, you had to create a new row in the table region and configure it using the Group properties dialog box. Moving forward, you can just drag a dataset field below a given group in the pane to create a new subgroup.
Clicking inside a textbox shows a Field Picker icon. When you click on it, you will see a dropdown of the dataset fields and conveniently pick the field instead of dragging it from the dataset fields to the textbox. While we are on this subject, you will notice that for the sake of brevity the Report Designer replaces the field expressions with tokens (enclosed with square brackets), such as [Sum(Sales)] instead of =Sum(Fields!Sales.Value). Clicking inside the textbox gives you access to the actual expression.
There is also a new Zoom pane which lets you zoom the report in and out. As you would expect from an early build, many features are not hooked up yet. For example, report preview requires uploading the report to the server.
Oh, yes… the thing in the middle is the new Tablix region but this is a topic for another post.


