What’s New in Office 2013 BI: Part 3 – Improved Productivity
Excel 2013 includes features that improve productivity. Here are the ones related to BI.
Flash Fill
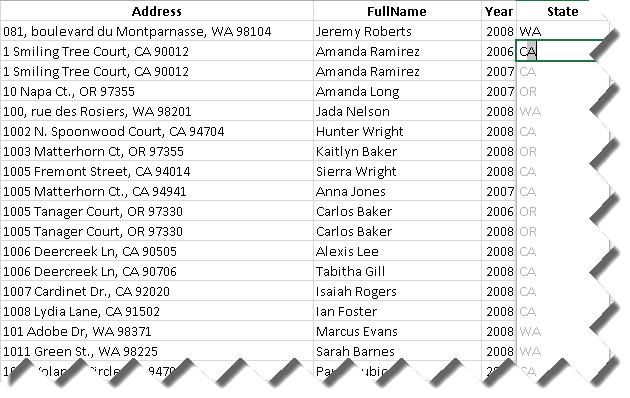
Suppose that you have a list of customers with addresses. When analyzing the data, you might want to analyze sales by USA states but the data doesn’t include a state column. Instead, suppose you have an address column that includes the mailing address, state, and zip code. So, you decide to create a new column. Now, instead of using a formula to parse the address as you would do in the past, you just enter WA in the first row. When you start typing CA in the second row, Excel figures the pattern and suggests to flash-fill the column. Notice that Flash Fill doesn’t use Excel formulas and you won’t get formulas in the column. Excel handles flash fill natively.

Quick Explore
This feature was included to allow you to quickly generate charts for analyzing data by time with Multidimensional and Tabular models. When you click a cell in a pivot report, the Quick Explore button is shown that gives you options to create trend or cycle chart. Notice that you can select another date dimension (table) to replace the default selection of Date.Calendar Date.
Note Excel 2013 charts don’t require supporting sheets with pivot reports anymore.

Speaking about analysis by time, Excel adds a new fitter, called “timeline”, that is specifically designed for this purpose. I found it an improved version of the Power View filter for integer fields. You can click a section in the timeline to select a specific period. Or, you can drag the mouse for an extended selection, such as years 2005-2007.

Quick Analysis
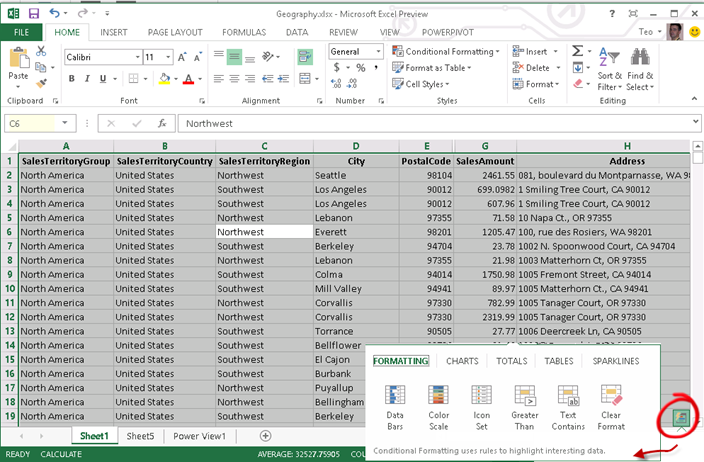
Suppose you have an Excel table but you don’t know much about pivot table, charts, and formatting. You can simply select the list (Ctrl+A) and click the Quick Analysis button to open a window that examines the dataset and suggests formatting (data bars, color scales, and conditional formatting, charts, tables, and sparklines.


