Where Is My DQS KB Gone?

Scenario: You use the DQS Cleansing Transformation in an SSIS package to integrate data cleansing with DQS. Once you are done developing, you export the DQS KB and then create a new DQS KB by importing and publishing the KB to another server. Or, you might have deleted and recreated the KB with the same name. When you open the DQS Cleansing Transformation Editor, although the KB name is the same, you find that the reference to your DQS KB is gone and you get a warning message “The data quality Knowledge Base property is empty. Specify a valid Knowledge Base”. Naturally, you don’t want to remap the KB and recreate all mappings as this a tedious process involving many steps with many columns.

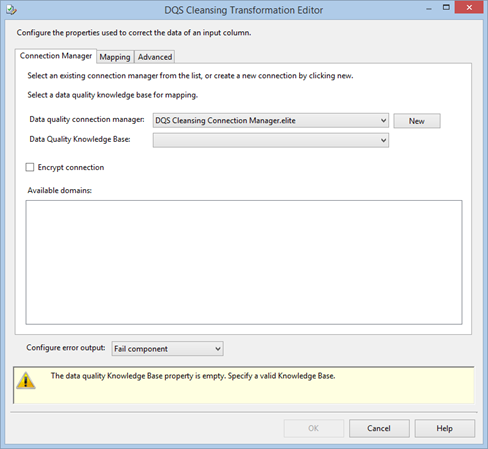
Solution: I’m not sure what design pattern was followed here, by SSIS identifies the KB by its identifier instead of by name. To fix the issue without remapping, you need to find the new KB ID and update the package source by following these steps:

  1. On the target SQL Server that is integrated with DQS, connect to the DQS_MAIN database and issue the following query by replacing the token with the name of your KB:
    SELECT * FROM [DQS_MAIN].[dbo].[A_KNOWLEDGEBASE] WHERE NAME = ‘<YOUR KB NAME>’
  2. In the query results, locate the ID column and copy the identifier.
  3. In SSDT, right-click on the package and then click View Code to open the package XML source.
  4. Find the knowledgebaseName property and overwrite the new identifier.

<property dataType=“System.Int64” name=“KnowledgebaseName” typeConverter=“NOTBROWSABLE”>1020033</property>

  1. Save the source and open the package in the designer.

Note that to resolve the KB identifier successfully, not only you need to import the KB on the target server but also publish the KB.

Power BI Desktop Supports Direct Connectivity to Tabular

As you’ve probably heard the news, Power BI went live yesterday. Among the many new features, Power BI Desktop (previously known as Power BI Designer) now supports live connections to Tabular. This is conceptually similar to connecting Excel to Tabular or Power View to Tabular to create ad hoc reports. However, Power BI Desktop is a standalone and freely available tool that is independent of Office or SharePoint.

When connected directly to Tabular, Power BI Desktop generates DAX queries as a result of report changes, sends them to Tabular and displays the results. Of course, we know we have new visualizations that don’t exist in Excel and on-prem Power View, such as tree maps, region maps, etc.

Upon discovering connectivity to Tabular, Power BI Desktop asks you how you want to connect:

Once you create the report, you can publish the dataset and report to Power BI. As a prerequisite, you need to install and configure the Analysis Services Connector to that the report can connect to Tabular on premises. If the connector is not installed, you will get an error on publishing. Speaking of the connector, at this time it cannot be installed side by side with the Personal Gateway which is used for refreshing data from on-prem data sources. You need to install them on separate machines.

Tabular is the first data source that supports direct connectivity in Power BI Desktop. I’d imagine that live connections to other data sources will follow soon. Direct connectivity is useful to support fast databases where there is no need to import and cache the data. In this case, you’ll need to weight out the pros and cons of direct connectivity vs. data import.

Atlanta BI Group Meeting on July 27th 2015

Come and join us for our next information-packed meeting on Monday, July 27th. Stacey Jones from UPS will present “Big Data as part of your Data Strategy” and Patrick LeBlanc from Microsoft will do a quick demo of Power BI Desktop now that Power BI has gone officially live. Our sponsor will be Prestige Staffing.

Presentation:

Big Data as part of your Data Strategy


Level: Intermediate

Date:

Monday, July 27th, 2015

Time

6:30 – 8:30 PM ET

Place:

South Terraces Building (Auditorium Room)

115 Perimeter Center Place

Atlanta, GA 30346

Overview:

New data technologies are evolving at an unprecedented pace. The traditional RDBMS is no longer the only choice for storing your data. Big data technologies such as Hadoop and other data technologies such as Data Virtualization, NoSQL, In-memory databases, Columnar Databases, and Graph databases offer new capabilities, but hold the potential to simply distract or disrupt business. Do relational databases still play a role? Using the wrong technology for the problem at hand can be expensive, time consuming, and counter-productive. I will discuss the importance of developing a data strategy for your company and how to determine the correct technologies. Takeaways:


•    Understand your data consumption needs

•    Document your data ecosystem

•    Develop your data strategy to apply the best data technology

Speaker:

Stacey Jones is a Data Architect filling the role of the UPS Chief Business Intelligence Evangelist. Stacey spends his time researching and promoting the use of modern BI- related technologies such as Big Data, Self-Service, Data Virtualization, Polyglot Persistence, In-Memory Databases and Predictive/Prescriptive Analytics. Stacey recently transitioned UPS from reporting to Self-Service Business Intelligence and architected the largest cube ever built at UPS. He is passionate about the art of writing and optimizing the performance of SQL queries, database design, database code, and all things BI. You can reach him at staceyjones@ups.com or on LinkedIn at https://www.linkedin.com/pub/stacey-jones/24/891/59

Prototypes with Pizza

Power BI Desktop with Patrick LeBlanc, Microsoft

Sponsor:

Prestige Staffing is an award-winning, nationally recognized leader staff augmentation. We specialize in providing elite candidates to fulfill job openings in the IT, Telecommunications, Healthcare and Accounting/Finance industries. Our clients include both Fortune 500 companies and small, local businesses. Our mission is to provide employers with only the most skilled applicants, while simultaneously helping qualified professionals improve their careers by placing them in the most ideal work situations.

Using DQS for Externalizing Data Validation Rules

Developers spend plenty of time coding for exceptions. The customer SSN must be 9 characters. The organization code must be four characters and it must be constrained to specific values. The happy path is easy, coding for exceptions is tedious. Some exceptions are easy to catch, others might require more complicated logic than implementing the happy path. And, it gets more difficult if the rules change often or your BI system needs to support adding new rules.

This is where Data Quality Services (DQS) can help. To me, the biggest strength of DQS is externalizing rules. Instead of hardcoding rules in SQL or ETL, you can externalize them and even offload rule management to business users. Using the Data Quality Client tool, a business user can define simple rules and corrections, such as that the e-mail address must match a specific regular expression. Then, the ETL developer can integrate the data flow with DQS to separate invalid and valid rows. Moreover, DQS will tell you exactly which rule is broken and a confidence factor for matching. This helps you avoid tedious coding and saves your company a lot of effort.

In its first release, DQS has left substantial areas for improvement which I hope SQL Server 2016 will address, including:

  1. I’m sure that there is a solid academic theory behind the “domains” concept, but requiring the user to create composite domains for simple-cross field validations might too much to ask. Instead, a better approach might be to have a hidden composite domain consisting of all fields.
  2. The lookup lists, such as “Value Is In” cannot be data-driven, requiring you to hardcode lookup values.
  3. More advanced rules are needed, such as IF-THEN, without requiring composite domains.
  4. Very slow performance with the SSIS DQS task because it uses a single thread.
  5. Currently, DQS has no API so automation is not possible.

Solving Datazen MDX Query Limitations

As I mentioned in a previous blog, Microsoft added Datazen to its arsenal of data visualization tools. Datazen, of course, comes with its own pros and cons. In this blog, you’ll see how you can get around a Datazen limitation when connected to an SSAS data model.

Scenario: You create a Datazen dashboard that sources data from an SSAS MD or Tabular model. As usual, you need a query that slices some measures by dimension attributes, such as the query below:

select {[Measures].[Sales Amount],[Measures].[Order Quantity]} on 0,

[Product].[Category].[Category].Members
on 1

from [Adventure Works] 

While this query works fine in SSRS, when Datazen runs the query it silently drops the dimension attributes from the result. You might attempt to rewrite the query as follows:

select [Product].[Category].[Category].Members * {[Measures].[Sales Amount],[Measures].[Order Quantity]} on 0

from [Adventure Works]

But then you get:

The query cannot be prepared. The query must have at least one axis. The first axis of the query should not have multiple hierarchies, nor should it reference any dimension other than the Measures dimension…        

Solution: The problem is that Datazen doesn’t support dimension attributes in the query resultset. This limitation is overly restrictive but there is a workaround by changing the query to return the desired dimension attributes as calculated members:

with
member CategoryName as
iif ([Measures].[Sales Amount]=0, null, [Product].[Category].CurrentMember.Member_Caption)

select {CategoryName, [Measures].[Sales Amount],[Measures].[Order Quantity]} on 0,

[Product].[Category].[Category].Members
on 1

from [Adventure Works]

Notice that the calculated member uses the Iif operator to check if a product category has data so that the query doesn’t return all categories whether they have data or not.

UPDATE 7/23/2015

Microsoft released an update that fixes this limitation. Now when you go through the wizard, there is a step that allows you to select which dimension properties you want in the results.

Power BI Custom Visuals Announced

Today Microsoft announced the general availability of Power BI on July 24th meaning that Power BI goes live on that date. Among the many new features mentioned in the blog, the one that piqued my interest is custom visuals. Developers might recall that SSRS has provided custom report items since version 2005, which I wrote about in the October 2006 issue of the MSDN Magazine. Similarly, now you can implement custom visualizations in Power BI! And, instead of writing .NET code, you can do so using JavaScript. This opens the path to implement custom visuals using any of the JavaScript-based visualization frameworks, such as D3, WebGL, Canvas, or SVG.

This will be huge as it will allow developers to extend the Power BI visualization capabilities using open-source visualization frameworks. Do you need some gadgets, like a bullet graph? With some coding wizardry, you can implement your own, such as by using the D3 Bullet Charts sample. Moreover, to speed up development, Microsoft has published the code of all of the existing Power BI visualizations on GitHub. Once you follow the instructions to install the Power BI Visuals Sample, you can open the project in Visual Studio and open in the browser index.html located in the PowerBIVisualsPlayground project. This allow you to test the visuals. The actual TypeScript code of the Microsoft visualizations is located in the Visuals project.
3833.custommap.jpg-400x0
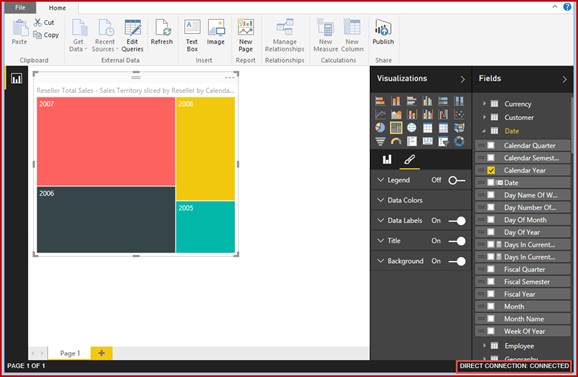
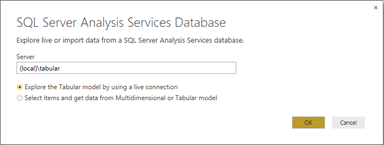
I think the Microsoft decision to make Power BI open will be a paradigm shift for the BI industry. Besides the Push API which are already published, Microsoft has already indicated plans to make Power BI even more open, such as to allow developers to embed reports in custom web applications. Now, if only Power BI supports on-prem installation …

Azure Data Catalog Announced

Microsoft just announced the public preview of Azure Data Catalog, previously known as “Project Tokyo”. I had a chance to take an early review of Azure Data Catalog to help a big organization which was interested in simplifying discoverability and access to data across the enterprise. As I mentioned in my “QUO VADIS DATA WAREHOUSE?” newsletter, logical data warehousing (LDW) has gained some traction and backing from vendors, including Composite (acquired by Cisco), Denado, and others.

“Logical data warehousing is at a very early stage of adoption. In my opinion, the companies that will benefit most of it are large organizations with many data repositories, where data availability is a major barrier for enabling self-service BI. If you believe that your organization might benefit from a Logical Data Warehouse, you might not need to make a major investment. If your organization has an Office 365 Power BI subscription, your first step could be leveraging the Power Query capabilities for dataset sharing and discovery. This process can work like this:

  1. Designated users promote virtual views in the form of Power Query queries to Office 365.
  2. A data steward verifies and approves these datasets.
  3. Once signed in to Office 365, other users can search, preview these queries, and import the associated data in self-service BI models.”

 You can view Azure Data Catalog is the Microsoft attempt to enter the logical data warehousing market. It also can be viewed as the next step of Power Query Dataset Sharing, now available as a standalone cloud service with new features. It’s all about providing and discovering the necessary metadata that describers the most valuable asset: your data. I welcome Azure Data Catalog but to make it more appealing to large organizations, which will be the most likely customers interested in it, I shared the following feedback with Microsoft:

  1. Support more data sources, as it stands Azure Data Catalog is limited to SQL Server as RDBMS. It’s paramount to support initially at least the most popular ones, including Oracle, DB2, Hadoop, SalesForce, etc. In fact, I don’t see why we can support all Power Query-supported data sources if we route the data acquisition through Power Query.
  2. Support for ODATA so that not only end users but applications can easily consume these shared datasets.
  3. Support for in-memory dataset caching to allow the administrator to configure the datasets to cache results on the server. This could be conceptually similar to SSRS shared dataset caching. Caching would allow us to avoid hitting underlying databases for slow queries.
  4. On-premise support – Cloud is great but it might be a hassle for a large organization to embrace the cloud if they haven’t done this already. Just extending their AD to the cloud would need to pass a lot of red tape.

Except this video, there isn’t much public information currently about Azure Data Catalog but that will probably change next week when Microsoft announces it officially.

What’s New for BI in Office 2016?

While you might be trying to convince management to upgrade to Office 2013, the next version of Microsoft Office (Office 2016) is on the horizon and scheduled to be released sometime in the Fall. Meanwhile, you can download and test the Public Preview. Naturally, you might wonder what’s new for BI given that Excel is the Microsoft premium BI desktop tool. In my newsletter, I’m sharing my favorite Excel 2016 BI features (most significant listed first).

Disaster Recovering

Over the last couple of weeks, I learned a thing or two about disaster recovery. My server crashed and it had to be replaced. While we were able to get Prologika.com up and running quickly, the community site was down for a while. I am happy to report that while there are some kinks remaining, for the most part the community site has been restored.