Prologika Newsletter Winter 2014


powerbiAfter an appetizer of embedded Power View reports , Microsoft proceeded to the main course that is a true Christmas gift – a pubic preview of what’s coming in its Power BI offering. For the lack of a better term, I’ll call it Power BI.NEXT. In this newsletter, you’ll see why Power BI.NEXT is much more than just an incremental release of the Office 365 Power BI, as you might have thought after reading the Microsoft announcement. As a participant in the private preview, I’m really excited about the new direction and the capabilities it opens.


WHY POWER BI.NEXT?

What do the United States of America and Microsoft BI have in common? They both decided to become independent for the welfare of their community. USA by choice. Microsoft BI by market conditions.

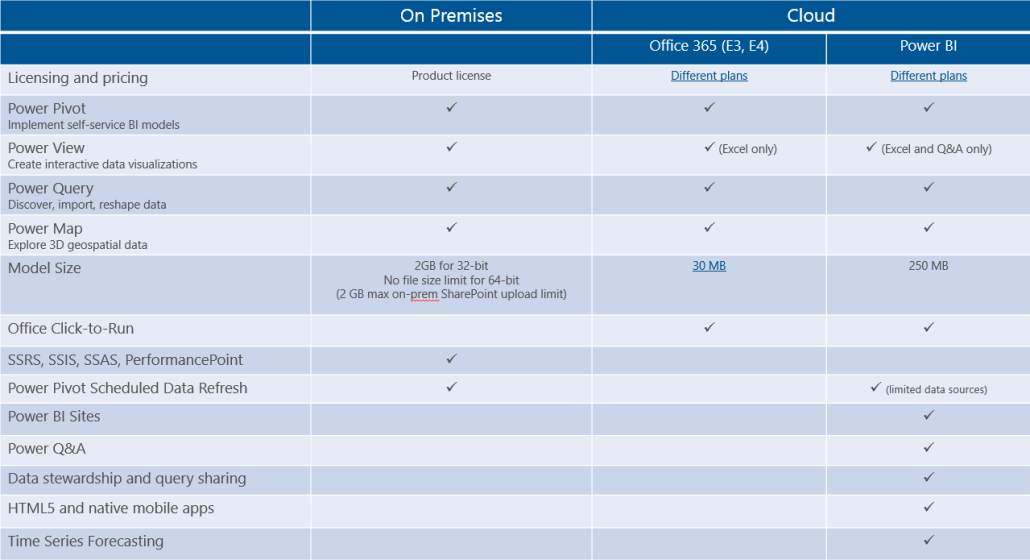
After more than a decade working with BI technologies and a variety of customers, I do believe that Microsoft BI is the best BI platform on the market. However, you and I both  know that it’s not perfect. One ongoing challenge is that various product groups have had a stake in Microsoft BI since Microsoft got serious about BI (circa 2004). Microsoft management promoted SharePoint as a platform for sharing BI artifacts. Major effort underwent to extend SharePoint with SSRS in SharePoint integration mode, PerformancePoint, Power Pivot, etc. But the hefty price tag of SharePoint and its complexity barred the adoption of BI on premises. Power BI for Office 365 alleviated some of these issues but many customers find its kitchen sink approach too overwhelming and cost-prohibitive if all they want is the ability to deploy BI artifacts to the cloud.

Similarly, seeking more market share and motivation for customers to upgrade, Excel added Power Pivot and Power View and was promoted as the Microsoft premium BI tool on the desktop. But adding new BI features to Microsoft Office turned out to be a difficult proposition. A case in point – it’s been two years since DAXMD got released and Power View in Excel 2013 still doesn’t support Multidimensional. In addition, because self-service BI was added to Excel later on, business users find it difficult to navigate the cornucopia of features. For example, there are at least three ways to import data in Excel (Excel native data import capabilities, Power Pivot, and Power Query).

Meanwhile, new self-service BI players entered the marketplace which was previously dominated by mega players. Although lacking technologically in their offerings, they gain in agility, simplicity, vendor neutrality, and aggressive pre-sales support. It appears that these market conditions caused a major shift in the Microsoft BI cloud vision that culminated in POWER BI.NEXT.

WHAT’S DIFFERENT?

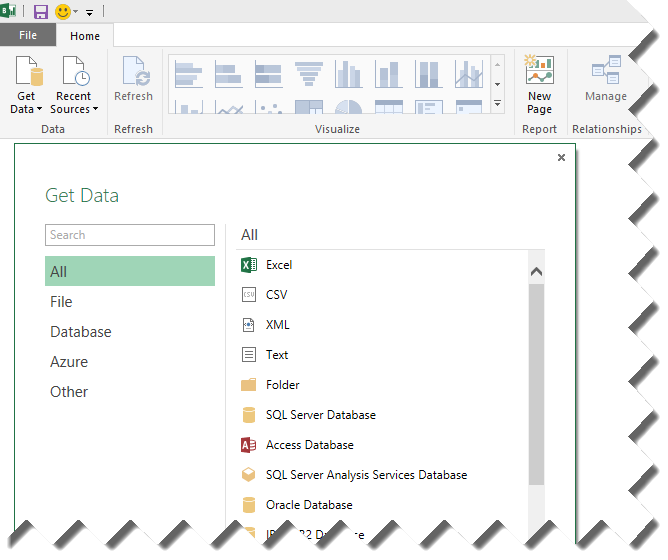
In my opinion, the main difference between Power BI.NEXT and Power BI for Office 365 is that Power BI.NEXT removes the Excel, SharePoint, and Office 365 adoption barriers. On the desktop, it introduces the Power BI Designer – a new BI design tool that unifies Power Query, Power Pivot, Power View and Power Map in a single environment that runs completely outside Excel (Excel BI features are still available for Excel users). Power BI Designer targets business users willing to create self-service data models and dashboards. Powered by Power Query, the designer simplifies data acquisition from a plethora of data sources.

pd

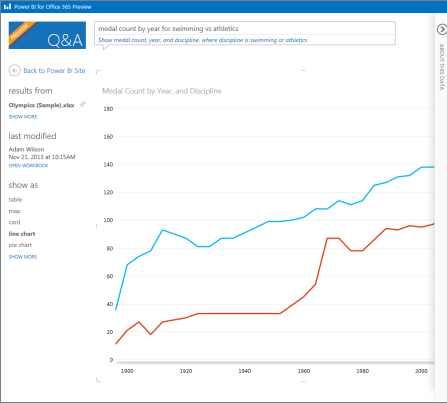
Similar to Power Pivot, Power BI Designer imports data (it seems that the preview version always imports data) into the xVelocity in-memory store backed up by a file in a zip format for durable storage (*.pbix file extension). For reporting, it uses integrated Power View reports that now render by default in HTML5 (if you inspect the page source of a deployed dashboard you’ll see that it uses jquery, angular, and the rest of the mobile dev stack) and natural Q&A (first introduced in Power BI for Office 365).

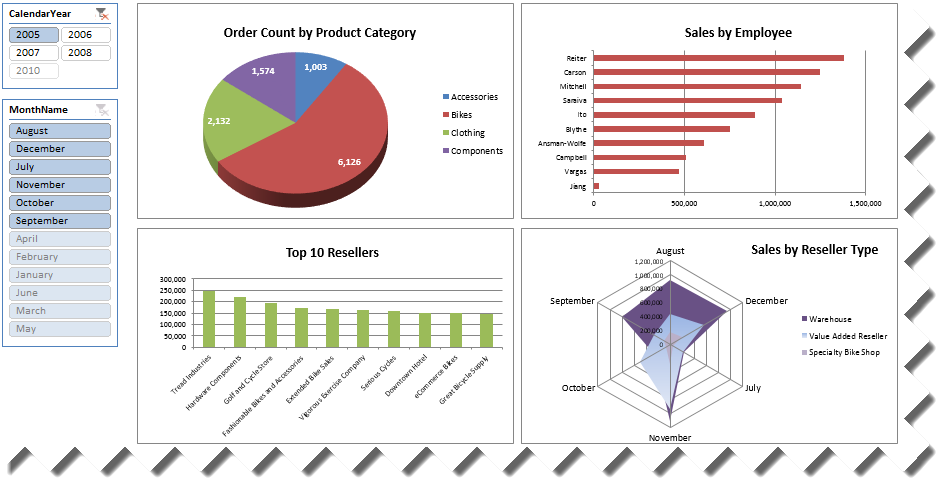
Another welcome addition is new visualizations that have been demonstrated in many public events, including funnel charts, tree maps, gauges, and others. Although the designer still doesn’t support this feature, the deployed dashboards demonstrate navigation to other report views for more detailed analysis. Unfortunately, action-based drillthrough and conditional formatting are not supported at this point).

Yet another great feature is the ability to connect dashboards deployed to the cloud to on-premise organizational Tabular models (support for Multidimensional is expected at a later time). This is great news for Office 365 customers who aren’t willing to move their data to the cloud yet but are OK with having reports in Power BI. This is accomplished by installing a new bridge connector called Analysis Services Connector Preview that runs independently from the Power BI Data Management Gateway which you might have used to refresh Power Pivot models deployed to Power BI for Office 365.

Another indication of the management shift that reflects market realities is the initial focus on native mobile applications for iPad (already available on the Apple Store) and Android.

Last but not least, always catering to developers, Microsoft has big plans. The Power BI Developer page describes the initial REST APIs that are currently in preview. I’m particularly interested in these APIs that will allow us to “integrate rich analytics into your application by embedding Power BI dashboards, tiles and reports” so we don’t have to rely on third-party controls.

WHAT’S NOT TO LIKE?

Although I’m very excited about Power BI.NEXT, there are some important features lacking in the preview. Currently, it’s a cloud-only offering and you can’t deploy it on premise. I hope we don’t have to wait for another management shift for this to happen given that the majority of my customers are not ready for the cloud yet.

Continuing down the list, the preview customization capabilities of Power View are still limited. To meet dashboard requirements more effectively, we need at least basic customization, such as conditional formatting and action-based drillthrough (as supported in SSRS).

As I mentioned previously, the ability to embed reports on web pages, such as to provide customer-facing reporting, is a must too. I hope the new Power BI will be more agile and add these features soon. Meanwhile, give your feedback and vote for the features you need!
As you’d agree, the BI landscape is fast-moving and it might be overwhelming. As a Microsoft Gold Partner and premier BI firm, you can trust us to help you plan and implement your data analytics projects.

Regards,

Teo Lachev

Teo Lachev
President and Owner
Prologika, LLC | Making Sense of Data
Microsoft Partner | Gold Data Analytics

EVENTS & RESOURCES

“Microsoft BI 2014 Review” presentation by Teo Lachev
Applied Excel and Analysis Services e-learning course by Teo Lachev
Atlanta BI Group: “Success in Business Intelligence requires Emotional Intelligence” by Javier Guillen on Jan 26th

Prologika Newsletter Fall 2014


aml

According to Gartner, one main data analytics trend this year and beyond will be predictive analytics. “Increasing competition, cost and regulatory pressures will motivate business leaders to adopt more prescriptive analytics, making business decisions smarter and more repeatable and reducing personnel costs”. Prologika has been helping our customers implement predictive analytics for revenue forecasting, outlier detection, and train data scientists in predictive analytics. This newsletter introduces you to Azure Machine Learning.


WHAT IS AZURE MACHINE LEARNING?

Microsoft unveiled the public preview of Azure Machine Learning (previously known as project Passau) in July 2014. Your humble correspondent has been participating in the private Preview Program to learn it firsthand and provide feedback. Microsoft Azure Machine Learning is a web-based service for cloud-based predictive analytics. You upload your data to the cloud, and then define datasets and workflows to create “experiments”. As you would recall, you can create organizational data mining models using the SQL Server Analysis Services and Excel data mining capabilities. Microsoft Azure Machine Learning to organizational DM models is what Power Pivot to Analysis Services is in a sense that it democratizes predictive analytics. It targets business users willing to create predictive models. The following figure shows a simple experiment to predict the customer’s likelihood to purchase a product.

bikebuyers

HOW DOES IT WORK?

The process of creating an experiment is simple:

  1. The user subscribes to the Azure Machine Learning service. For the pricing details of the public preview service, see this page (be aware that with all cloud-based offerings, everything is subject to change). Currently, the user is charged 38 cents per hour to use the service.
  2. The user defines the input data by uploading a file. Supported file formats include CSV, tab-delimited, plain text, Attribute Relationship File Format, Zip, and R Object or Workspace. In addition, Azure Machine Learning can connect to Azure cloud data sources, such as HDInsight or Azure SQL Server.
  3. The user creates an experiment which a fancy term for a workflow that defines the data transformations. For example, the user might want to filter the input dataset or use just a sample of the input data. In my case, I used the Split data transformation to divide the input dataset into two parts: one that is used for training the model, and the second one that is used for predictions.
  4. The user selects a Machine Learning algorithm(s) that will be used for predictions. In this case, I used the Two-Class Boosted Decision Tree algorithm. This is where users will need some guidance and training about which mining algorithm to use for the task at hand.
  5. The user trains the model at which point the model learns about the data and discovers patterns.
  6. The user uses a new dataset or enters data manually to predict (score) the model. For example, if the model was used to predict the customer probability to purchase a product from past sales history, a list of new customers can be used an input to find which customers are the most likely buyers. The Score Model task allows you to visualize the output and to publish it as a Web service that is automatically provisioned, load-balanced, and auto-scaled, so that you can implement business solutions that integrate with the Web service.

WHY SHOULD YOU CARE?

Implementing predictive solutions has been traditionally a difficult undertaking. Azure Machine Learning offers the following benefits to you BI initiatives:

  1. It simplifies predictive analytics by targeting business users.
  2. As a cloud-based offering, it doesn’t require any upfront investment in software and hardware.
  3. It promotes collaboration because an experiment can be shared among multiple people.
  4. Unlike SQL Server data mining, it supports workflows, similar to some high-end predictive products, such as SAS.
  5. It supports R. Hundreds of existing R modules can be directly used.
  6. It supports additional mining models that are not available in SQL Server Analysis Services and that came from Microsoft Research.
  7. It allows implementing automated business solutions that integrate with the Azure Machine Learning service.


As you’d agree, the BI landscape is fast-moving and it might be overwhelming. As a Microsoft Gold Partner and premier BI firm, you can trust us to help you plan and implement your data analytics projects.

Regards,

Teo Lachev

Teo Lachev
President and Owner
Prologika, LLC | Making Sense of Data
Microsoft Partner | Gold Business Intelligence

EVENTS & RESOURCES

Atlanta BI Group: Atlanta BI Group: DAX 101 on September 29th
Atlanta BI Group: Atlanta BI Group: Predictive Analytics From Theory to Practice on October 27th

Prologika Newsletter Summer 2014


powerbiDuring the Day 1 keynote at the 2014 BA Conference, Microsoft committed to BI on your terms. They said that all new features will be eventually available both on premises and in the cloud. We’ve also learned that hybrid scenarios will be possible in near future, such as hosting Power View and SSRS reports in the cloud connected to on-prem data sources. Based on my coversations with customers, many people are confused which path (on-prem or cloud) to take. I hope this newsletter clarifies.


BI ON YOUR TERMS

The following table should help you understand how the Microsoft on-prem and cloud BI offerings compare at a high level (click to enlarge the image). Choosing between on-prem and cloud BI is essentially a decision about where SharePoint would be installed.

options

Self-service and Team BI

Microsoft markets Power BI as “self-service BI with the familiarity of Office and the power of the cloud”. It’s important to clarify however that the self-service BI tools (Power Pivot, Power View, Power Query, and Power Map) that are shown in green in the diagram below are implemented as add-ins to Excel and thus are available to no additional cost for Excel users.

bi

In other words, you don’t need an Office 365 or Power BI license to use these tools. You can purchase Office from a retailer, such as Amazon, and have all of the Excel “power” components:
Power Pivot: Integrated with Excel 2013 (needs to be downloaded for Excel 2010)
Power Query: Needs to be downloaded for both Excel 2010 and 2013
Power Map: Needs to be downloaded for Excel 2013 (doesn’t support Excel 2010).
Power View: Integrated with Excel 2013 (not available for Excel 2010
but available in SharePoint Server integrated with SQL Server 2012)

The orange box on the right is the SharePoint cloud infrastructure that enables team BI for exploring and sharing BI artifacts. You can think of it as an upgrade to Office 365 that is available on a subscription basis. For example, while Office 365 (Midsize Business, E3, E4) allows Excel workbooks with pivot and Power View reports to be rendered online, it limits the workbook size currently to 30 MB (a more detailed Office 365 feature breakdown is available online).By contrast, Power BI supports models up to 250 MB in size and on-prem SharePoint supports file sizes up to 2 GB in size. Note that the cloud data size limits are likely to change upwards. So, the model size is one factor to consider when planning your team BI environment.

Office Click-to-Run

Most corporate Office installations are performed by downloading and running the MSI installer. The MSI setup is a perpetual one (you pay for a version once and you’re entitled to fixes for it). If you have an Office 365 subscription, you can install the Click-To-Run version of Office. This is a subscription-based Office 365 setup. You continuously pay for using the software and you’re entitled to fixes and the latest features within the O365 plan you’re subscribed to. I wrote more about the Office C2R setup in this blog.

Organizational BI

At this point, both Office 365 and Power BI are all about self-service and team BI delivered with Excel workbooks that embed Power Pivot modes. The typical scenario is that a power user would create a BI model and reports on the desktop and share these artifacts by deploying to the cloud. The rest of the BI tools that are typically used for organizational BI (SSIS, SSRS, SSAS, PerformancePoint Services) are not yet available in the cloud.

As I mentioned in the beginning, at the BA conference Microsoft said that they plan to host SSRS and Power View in the cloud in near future to enable hybrid scenarios. Meanwhile, the only way to build a MS cloud-based organizational solutions would be to deploy them to Azure virtual machines, with the exception of SQL Server Database Engine and Reporting Services which as available as Platform as a Service (PaaS) Azure offerings.

Additional Features

As an upgrade to Office 365, Power BI has additional features that are currently only available in Power BI, such as Q&A, data stewardship, and so on. I discussed these features in more details in my previous newsletter. Microsoft plans to release new BI features first to Power BI and then to on-prem SQL Server and SharePoint. An example of such a feature is Power View Time Series Forecasting which just got released to Power BI.


As you’d agree, the BI landscape is fast-moving and it might be overwhelming. As a Microsoft Gold Partner and premier BI firm, you can trust us to help you plan and implement your BI projects.

Regards,

Teo Lachev

Teo Lachev
President and Owner
Prologika, LLC | Making Sense of Data
Microsoft Partner | Gold Business Intelligence

EVENTS & RESOURCES

Atlanta BI Group: Microsoft BI for Financial Reporting by Justin Stephens on June 30th
Atlanta BI Group: Integrating Data Mining by Mark Tabladillo on July 28th
Atlanta BI Group: Making Your SSIS Fly Beyond the Sky by Carlos Rodriguez on August 25th

Prologika Newsletter Spring 2014


powerbi
I hope you are enjoying the beginning of the spring. The focus of this newsletter is self-service BI with Microsoft Power BI. But before I start, I strongly encourage those of you in the Southeast USA to register and attend the SQL Saturday Atlanta event which will be held this year on May 3rd. We had a record attendance last year with some 570 people attending SQL Saturday Atlanta! You can also sign up for the preconference sessions on Friday, May 2nd, one of which will be delivered by your humble correspondent.


POWER BI

Nowadays, every organization has some sort of a self-service BI tooling, ranging from Excel spreadsheets and Access databases to sophisticated self-service data models implemented by power users. Microsoft self-service BI is centered around Excel with PowerPivot on the desktop and SharePoint on the server. SharePoint does offer a wealth of features that you might find appealing, as I’ve recently discussed in my “Is SharePoint Overkill for BI” post. However, Microsoft self-service BI has been traditionally criticized for its deployment complexity and steep price tag.

To mitigate these concerns, Microsoft introduced a few years ago Office 365 (E3 or E4 plan required) and SharePoint Online (Plan 2 required) to allow you to deploy self-service BI artifacts created with Power Pivot and Power View to the cloud. Recently, Microsoft unveiled Power BI as a next step in its BI cloud strategy. Power BI is essentially a cloud combo of all the self-service “power” tools (Power Pivot, Power View, Power Query, and Power Map) available on a subscription basis and running on Microsoft Azure.

What’s to like?

Here are some reasons why you should consider Power BI:

Avoid SharePoint on-premises installation and licensing
Microsoft maintains and scales SharePoint, not your IT department. Instead of paying on-premise SharePoint Server and SQL Server licenses, you pay a subscription price per user using one of these three pricing options.

Get new features
Some self-service BI features are currently only available in Power BI. The most important ones are natural queries (aka Q&A), Power View mobile support, sharing PowerPivot queries, and great Power Map geospatial visualizations.

Always up to date
As I’ve explained recently in my “The Office Click-To-Run Setup” post, Office 365 and Power BI subscribers can install the Office Click-To-Run setup and receive new features continuously.

qa

Cautions

Besides the usual concerns about security and data ownership associated with a cloud deployment, here are some additional considerations to keep in mind:

Self-service BI only
Unlike Azure virtual machines, Power BI can’t be configured as an extension to your Active Directory domain. Therefore, you can’t deploy Power View reports connected to organizational Multidimensional or Tabular models. However, Microsoft has implemented a data management gateway that you can install on premises to schedule your cloud Power Pivot data models for automatic refresh from your on-premise data sources.

Compatibility issues
If you decide to install Office Click-To-Run, your Office installation will be updated periodically while your on-premise SharePoint won’t. Consequently, you might not be able to deploy Power Pivot models that have the latest features to your on-premise SharePoint instance. In other words, if you use the Office Click-to-Run setup you should commit to deploying to Power BI to share data models and reports with other users.

Size limitations
Currently, Power BI limits your models to 250 MB in size. However, because of the Power Pivot efficient data compression, you should be able to pack millions of rows in your model.

I believe that cloud BI has come out of age and the Power BI ease of deployment and rich assortment of features should warrant your attention. To start a trial or learn more the Power BI capabilities and visualizations, visit Power BI.


As you’d agree, the BI landscape is fast-moving and it might be overwhelming. As a Microsoft Gold Partner and premier BI firm, you can trust us to help you plan and implement your BI projects.

Regards,

Teo Lachev

Teo Lachev
President and Owner
Prologika, LLC | Making Sense of Data
Microsoft Partner | Gold Business Intelligence

EVENTS & RESOURCES

Atlanta BI Group: Custom ETL Frameworks with SSIS 2012 by Aneel Ismaily on 3/31
Atlanta BI Group: Power BI by Brian Jackson on 4/28
SQL Saturday Atlanta: A full day of SQL and BI on 5/3

Prologika Newsletter Winter 2013


sql2014As I’m enjoying my vacation in tropical Cancun, Mexico, I hope you’ve been enjoying the holidays and planning your BI initiatives in 2014. Speaking of planning, you may have heard that Microsoft is working hard on next release of SQL Server, version 2014, which is expected in the first half of next year. Naturally, you may wonder what’s new in the forthcoming release in the BI arena. If so, keep on reading.


Just when you thought that you can finally catch your breath after the SQL Server 2012 and Office 2013 waves, SQL Server 2014 is looming on the horizon. Relax, version 2014 will be a database-focused release with no major changes to any of BI services: SSAS, SSRS, SSIS, PowerPivot, MDS and DQS. However, there are a couple of important enhancements that you might find more or less relevant to your BI projects. If they sound interesting, I encourage you to download and install the second Community Technology Preview (CTP2) of SQL Server 2014 so you can try and plan for the new features. CTP2 is a feature-complete build and new features are expected in the release bits.

Memory-optimized Tables

Previously code-named Hekaton, this new in-memory storage option allows you to host SQL Server tables in memory in order to improve I/O. Interestingly, Microsoft is the only vendor that ships the in-memory technology in the box without charging more for it. Moreover, this new enhancement doesn’t require new skills as it integrates seamlessly with SQL Server. It really is an enhancement. While predominantly targeting OLTP applications, I believe memory-optimized could be useful for narrow-case BI scenarios as well, such as for improving the performance of the ETL processes by using in-memory staging tables.

For example, ETL might require complex transformations with heavy I/O as a part of the nightly data warehouse load. With a few minor schema changes, you could configure the staging table in memory. Just by doing so you will gain significant performance improvements. How much improvementt? Results will vary depending on the ETL specifics of course. According to Microsoft, many applications see very significant performance gains, on average 10X, with results up to 30X. Much like optimizing hardware configurations, the results you get vary significantly depending on how much effort you put into the project. You can do a very simplistic, and low cost project, defining hot tables as memory optimized, and doing no other changes, or you can rewrite stored procedures to be natively compiled, investing more effort, and resulting in much better results. Here are additional resources to get you started with this great technology:

Server 2014 In-Memory Technology Blog Series Introduction
Getting Started with SQL Server 2014 In-Memory OLTP
In-Memory OLTP: Q & A Myths and Realities
Architectural Overview of SQL Server 2014’s In-Memory OLTP Technology

Clustered Columnstore Indexes

Introduced in SQL Server 2012, columnstore indexes were intended to speed up typical BI-type queries that aggregate many rows but request only a few columns. As we reported in this Microsoft case study “Records Management Firm Saves $1 Million, Gains Faster Data Access with Microsoft BI”, with columnstore indexes resource-intensive ETL queries achieved 10X performance gains. Specifically, their execution time dropped from about 20 minutes to less than 2 minutes.

On the downside, columnstore indexes were not updatable in SQL Server 2012, requiring ETL processes to drop and recreate the index after the load was completed. That wasn’t a huge issue for this specific project because creating the index on a fact table with 1.5 billion rows took about 20 minutes. Even better, in SQL Server 2014, Microsoft introduces clustered columnstore indexes and they will be updatable so you don’t have to drop the index. To gain the most from columnstore indexes, make sure that the queries that use them execute in a batch mode and not in row by row mode.

For more information about columnstore index internals and improvements in 2014, read the excellent “Enhancements to SQL Server Column Stores” whitepaper by Microsoft.


As you know, the BI landscape is fast-moving and it might be overwhelming. If you have Software Assurance benefits, don’t forget that as a Microsoft Gold Partner and premier BI firm, Prologika can use your SA vouchers and work with you to help you plan and implement your BI initiatives, including:

  • Analyze your current environment and determine a vision for a BI solution
  • Define a plan to launch a BI reporting and analysis solution
  • Upgrading or migrating to SQL Server 2012

Regards,

Teo Lachev

Teo Lachev
President and Owner
Prologika, LLC | Making Sense of Data
Microsoft Partner | Gold Business Intelligence

EVENTS & RESOURCES

Atlanta BI Group: Bus Matrix – the foundation of your Dimensional Data Model by Bill Anton
Atlanta BI Group: Data Warehousing by Lance England
SQL Saturday Atlanta: May 3rd, 2014

Prologika Newsletter Fall 2013


bismI hope you had a great summer. The chances are that your organization has a centralized data repository, such as ODS or a data warehouse, but you might not use it to the fullest. Do you want a single version of truth? Of course, you do. Do you want to empower your business users to create their own reports and offload reporting effort from IT? I bet this is one of your top requirements. A semantic layer could help you achieve these objectives and much more… In this newsletter, I’ll discuss the importance of having a semantic layer that bridges users and data.


WHY SEMANTIC LAYER?

A semantic layer sits between the data and presentation layers. In the world of Microsoft BI, its role is fulfilled by the Business Intelligence Semantic Model (BISM) which encompasses the Multidimensional and Tabular implementation paths. The first chapter (you can download it from the book page) of my latest book “Applied Microsoft SQL Server 2012 Analysis Services (Tabular Modeling)” explains this in more details.

bismd

Here are 10 reasons why you should have a semantic layer:

  1. Abstraction
    In general, semantics relates to discovering the meaning of the message behind the words. In the context of data and BI, semantics represents the user’s perspective of data: how the end user views the data to derive knowledge from it. Before we expose data to end users, we need to translate the machine-friendly database structures and terminology into a user-friendly semantic layer that describes the business problems to be solved. To address this need, you create a semantic layer.
  2. Reducing reporting effort
    Based on my experience, the typical IT department is caught in a never-ending struggle to create operational reports. A semantic layer is beneficial because it empowers business users to create their own ad hoc reports. For example, one of the nice features of Analysis Services is that the entity relationships become embedded in the model. So, end users don’t have to know how to relate the Product to Sales entities. They just select which fields they want on the report (Excel, Power View) and the model knows how to relate and aggregate data.
  3. Eliminating “spreadmarts”
    It seems that all the end users want is Excel data dumps so they can create pivot reports to slice and dice data. In many cases, self-service BI is actually a polished and extended version of the “spreadmart” trend. If this bothers you (and it should), the only way to minimize and eliminate this issue is to have a semantic layer that allows business users to analyze the data from any subject area without having to export the data. Moreover, a semantic layer is a true self-service BI enabler because it allows the users to focus on data analysis instead of data preparation and model creation – skills that many users lack and might struggle with.
  4. Performance
    The semantic layer should provide excellent performance when aggregating massive amounts of data. For example, in a real-life project we are able to achieve delivering operational reports within milliseconds that require aggregating a billion rows. Try to do that with relational reporting, especially when you need more involved calculations, such as YTD, QTD, parallel period, etc.
  5. Reducing cost
    Do you have biggish data and struggle with report performance? Related to the previous point, having a semantic layer might save you millions of dollars to overcome performance limitations (to a point) by purchasing MPP systems, such as Teradata or Netezza.
  6. Centralizing business logic
    The unfortunate reality that we’re facing quite often is that many important business metrics end up being defined and redefined either in complex SQL code or reports. This presents maintenance, implementation, and testing challenges. Instead, you can encapsulate metrics and KPIs where they belong – in your semantic model so they can be reused across reports and dashboards.
  7. Rich client support
    Many reporting tools are designed to integrate and support popular semantic models. For example, Microsoft provides Excel on the desktop and the SharePoint-based Power View tool that allows business users to create their own reports. Do you like a specific third-party reporting tool? The chances are that it supports Analysis Services.
  8. Security
    How much time do you spend implementing custom security frameworks for authorizing users to access data they are allowed to see on reports? Moving to Analysis Services, you’ll find that the model can apply security on connect. I wrote more about this in my article “Protect UDM with Dimension Data Security”.
  9. Isolation
    Because a semantic layer sits on top of the relational database, it could provide a natural separation between reports and data. For example, assuming distributed deployment, a long-running ETL job in the database won’t impact the performance of the reports serviced by Analysis Services.
  10. Additional BI capabilities
    A semantic layer can futher enrich your BI solution with appealing features, such as actions, KPIs, and predictive analytics.

HOW DO YOU CHOOSE SEMANTIC LAYER?

Different vendors have different ideology and implementations of semantic layers. Some, such as Oracle and MicroStrategy, implement the semantic layer as a thin, pass-through layer whose main goal is to centralize access to data sources, metadata and business calculations in a single place. For example, a Fortune 100 company that had a major investment in Oracle engaged us to recommend a solution for complementing their OBIEE semantic layer with user-friendly reporting tool that would allow end users to create ad hoc transactional reports from their Oracle Exadata-based enterprise data warehouse. In the OBIEE world, the role of the semantic layer is fulfilled by the Common Enterprise Information Model that encompasses data sources, metrics, calculations, definitions, and hierarchies. When users submit report queries, the Oracle BI Server compiles incoming requests and auto-generates native queries against the data sources plugged in the Common Enterprise Information Model. In theory, this “thin” implementation should work pretty well. In reality, several issues surface:

Performance
Any tool, either a reporting tool or semantic layer, that auto-generates queries should be highly suspect of performance issues. First, no matter how well the tool is designed, it’s unlikely that it would generate efficient queries in all cases. Second, because the tool sends the query to the underlying data source, the overall report performance is determined by how fast the data source crunches data. In this case, the organization was facing performance issues with data aggregation. To circumvent them, their BI developers have implemented summarized fact tables. Once the user reaches the lowest level of the summary fact table, OBIEE would allow the user to drill down to a chained table, such as the actual fact table. Needless to say, business users were complaining that analysis was limited to the dimensionality of the summarized fact table. Further, to avoid severe performance issues with historical reports, the BI developers have taken the “no big aggregations, no problem” approach by forcing a time filter on each request that touches the large fact tables. This effectively precluded historical analysis by year, quarter, etc.

Scalability
When a query involves multiple data source, OBIEE would send a query to each data source, load the data in memory, and then join the datasets together to find matching data. This also presents performance and scalability challenges. To solve performance and scalability issues with “thin” semantic layers and biggish data, organizations ultimately resort to expensive back-end MPP systems, such as Teradata or Netezza, which can parallelize data crunching and compensate for inefficient auto-generated queries. But this is a costly solution!

Common denominator
You’re limited you to a subset of supported features of the underlying data source. Such an architecture ultimately locks you in the data sources supported by the vendor. What happens when there is a new version of the data source that has some cool new features? Well, you need to wait until the vendor officially supports.

The big difference between Microsoft and other vendors in terms of semantic layer implementation is that by default both Multidimensional and Tabular store data on the server. This proprietary storage is designed for fast data crunching even with billions of rows. You pay a price for loading and refreshing the data but you enjoy great query performance with historical and trend reports. And, you get a great ROI because you may not need an expensive MPP appliance or excessive data maintenance. When sent to BISM, queries are served by BISM, and not by the RDBMS. No need for summarized tables and time filters. the new version and its extensions

As you know, the BI landscape is fast-moving and it might be overwhelming. If you have Software Assurance benefits, don’t forget that as a Microsoft Gold Partner and premier BI firm, Prologika can use your SA vouchers and work with you to help you plan and implement your BI initiatives, including:

  • Analyze your current environment and determine a vision for a BI solution
  • Define a plan to launch a BI reporting and analysis solution
  • Upgrading or migrating to SQL Server 2012

Regards,

Teo Lachev

Teo Lachev
President and Owner
Prologika, LLC | Making Sense of Data
Microsoft Partner | Gold Business Intelligence

EVENTS & RESOURCES

Atlanta BI Group: Dimensional Modeling 101 by Julie Smith on September 30th presentation
Atlanta BI Group: Head-to-Head on Maps by Dave Tangren on October 28th
SQL Saturday Charlotte: Best Practices for Implementing Enterprise BI Solution presentation by Teo Lachev on October 19th

Prologika Newsletter Summer 2013


dashboard

The summer is finally here. With everything coming to fruition, there are exiting news in the Microsoft BI land, the most important of which I’d like to recap in this newsletter. Before I start, I want to mention the availability of my Best Practices for Implementing Enterprise BI Solution presentation that you might find interesting.

POWER VIEW MULTIDIMENSIONAL

Also known as DAXMD, Power View has been extended in Cumulative Update 4 for SQL Server 2012 SP1 to support traditional OLAP cubes (known in SQL Server 2012 as Multidimensional). Now business users can easily author ad-hoc reports and interactive dashboards by leveraging your investment in OLAP. In my opinion, it should have been the other way around and Power View should have initially targeted Multidimensional. That’s because Multidimensional has much a larger install base than Tabular (recall that the latter debuted in SQL Server 2012). But better later than never, right? As a proud contributor to the DAXMD TAP program, I’m delighted with the results, as I discussed in my blog “DAXMD Goes Public”. I hate to dampen the spirit but be aware that as of now only the SharePoint version of Power View has been extended to support Multidimensional. We don’t know yet when the same will happen to Power View in Excel 2013. Anyway, this is a very important BI enhancement and it’s time to plan your DAXMD testing and deployment. Read the official announcement here.

daxmd

NEW SELF-SERVICE BI TOOLS

Never wavering in its commitment to self-service BI, Microsoft announced new tools to help business users transform and visualize data in Excel. Currently in preview, GeoFlow is a new 3D visualization add-in for Excel for mapping, exploring, and interacting with geographical and temporal data. GeoFlow requires Excel 2013. As it stands, it can source data from Excel spreadsheets only. Since this is somewhat limiting and I’d expect it to integrate with PowerPivot, or even better Analysis Services, at some point in future.

geoflow

Also in preview, Data Explorer is an add-on to Excel (Excel 2013 and 2010 are supported) that allows business users to discover and transform data before they analyze it in Excel or PowerPivot. In other words, Data Explorer is to Integration Services what PowerPivot is to Analysis Services. Some of my favorite Data Explorer features are the ability to merge, split, and unpivot columns. If your organization is into self-service BI and Data Explorer sounds interesting, check the Data Explorer tutorials. Check also the “5 Things You Need to Know about the Microsoft Data Explorer Preview for Excel” blog post by the Microsoft BI team.

WINDOWS AZURE INFRASTRUCTURE SERVICES

Microsoft announced also the availability of Windows Azure Infrastructure Services which is a collective name for running Virtual Machines and Virtual Networks in the cloud. Pricing get slashed too to be competitive with Amazon. What’s interesting is that these cloud VMs can be configured as an extension to your existing network. Speaking of BI, check the SQL Server Business Intelligence in Windows Azure Virtual Machines document if you’re interested in cloud BI deployments. Notice that there are VM templates that install SSRS (native mode), SSAS (Multidimensional), as well as SharePoint 2013 but you can install manually the other components as well if you need to, such as Tabular. Microsoft recommends Extra Large VM size for BI deployments although its memory capacity (14 GB) might be on the lower end especially for Tabular.

As you know, the BI landscape is fast-moving and it might be overwhelming. If you have Software Assurance benefits, don’t forget that as a Microsoft Gold Partner and premier BI firm, Prologika can use your SA vouchers and work with you to help you plan and implement your BI initiatives, including:

  • Analyze your current environment and determine a vision for a BI solution
  • Define a plan to launch a BI reporting and analysis solution
  • Upgrading or migrating to SQL Server 2012

Regards,

Teo Lachev

Teo Lachev
President and Owner
Prologika, LLC | Making Sense of Data
Microsoft Partner | Gold Business Intelligence

EVENTS & RESOURCES

SQL Saturday: Best Practices for Implementing Enterprise BI Solution presentation
Atlanta BI Group:Developing Custom Task in SSIS 2012 by Aneel Ismaily on 6/24
Atlanta BI Group: BI Theory vs. Practice by William Pearson on 7/27

Prologika Newsletter Spring 2013

Implementing Dashboards

dashboard
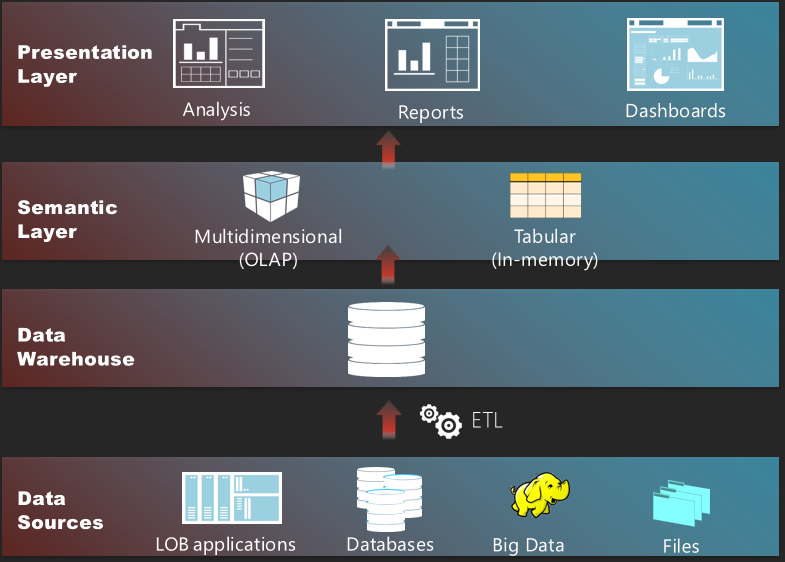
Many organizations are considering digital dashboards for a quick 1000-foot view of the company performance. In this newsletter, I’ll review at a high level the options available in the Microsoft BI Platform for implementing dashboards and discuss how they compare.


PerformancePoint Services

PerformancePoint Services has been the Microsoft’s premium tool for implementing dashboards and scorecards in the SharePoint environment. Geared toward BI pros, PerformancePoint allows you to assemble content from multiple data sources and display it in interactive web-based dashboard pages. The screenshot (click to enlarge) demonstrates a PerformancePoint-based dashboard that Prologika implemented for a document management company.

pp

The Operational Scorecard by Month Scorecard displays a set of vital key performance indicators that are defined in an OLAP cube. The end user can filter the scorecard by month and territory, and SharePoint “remembers” the user selection. When the user selects a KPI row, the Operational Details Report Months section refreshes to show more context about that KPI. Moreover, the user can right-click a given cell of interest and initiate additional exploration. For example, the user can launch the Decomposition Tree to see how that value is contributed by other subject areas. The Show details menu drills through the cell and the Additional Actions menu allows the user to initiate a cube action (if defined in the cube). And, the user can change the report layout, such as switch from tabular to chart format, by using the Report Type menu. PerformancePoint requires SharePoint Server Enterprise Edition. It includes an authoring tool called Dashboard Designer which a BI pro can use to implement the dashboard.

Excel and Excel Services

If Excel pivot reports are sufficient to convey the dashboard message then look no further than Excel. You can connect Excel to an analytical layer, such as an OLAP cube or a Tabular model, and quickly assemble a dashboard consisting of PivotTable and PivotChart reports, such as this one.

excel

Once the dashboard design is complete on the desktop, you can upload the Excel file to SharePoint to publish the dashboard and make it available to other users. Thanks to Excel Services, SharePoint will render the dashboard in HTML and preserve its interactive features. And, in SharePoint 2013, end users can update the dashboard, such as by adding new fields to the pivot reports. Excel Services is available in SharePoint Server Enterprise edition.

Power View

Starting with SQL Server 2012, you have yet another option to design dashboards in SharePoint environment. Although the primary focus of Power View is ad hoc reporting, it can be used to implement highly-interactive dashboards connected to an analytical layer (Analysis Services Tabular and soon Multidimensional models). And, because it’s very easy to use, it allows business users with no BI or reporting skills to take the dashboard implementation in their own hands.

powerview

With a mouse click, end users can switch between visualizations, such as switching between a tabular report to a pie chart. Visualizing geospatial information, such as sales by region, has never been easier thanks to integration with Bing maps. And, maps are interactive to allow you to drill down, such from country to city. Power View requires SharePoint Server Enterprise Edition.

Reporting Services

Finally, don’t rule out Reporting Services reports. Although lacking in interactivity, operational reports gain in extensibility and customization. Moreover, this is the only implementation option in the Microsoft BI stack that doesn’t necessarily require SharePoint although you can deploy reports to SharePoint Foundation or higher edition.

ssrs

Summary

The following table summarizes the four dashboard implementation options.

TechnologyProsCons
PerformancePointDesigned for scorecards and KPIs
Supporting views
Decomposition tree
Customizable
BI pro-oriented
No “wow” effect
ExcelFamiliar pivot reports
Easy to implement
End-user oriented
Updatable views need SP13
No “wow” effect
Power ViewHighly interactive
Easy to implement
End-user oriented
No extensibility
No support for mobility
Requires Silverlight
Reporting ServicesHighly customizable
Rich visualizations
Doesn’t require SharePoint
Require SSRS skills
Canned reports
No “wow” effect

To learn more about dashboarding with Microsoft BI, attend my “Building Dashboards with the MS BI Stack” presentation for SQL Saturday in Atlanta on May 18th.


As you know, the BI landscape is fast-moving and it might be overwhelming. If you have Software Assurance benefits, don’t forget that as a Microsoft Gold Partner and premier BI firm, Prologika can use your SA vouchers and work with you to help you plan and implement your BI initiatives, including:

  • Analyze your current environment and determine a vision for a BI solution
  • Define a plan to launch a BI reporting and analysis solution
  • Upgrading or migrating to SQL Server 2012

Regards,

Teo Lachev

Teo Lachev, MVP (SQL Server), MCSD, MCT, MCITP (BI)
Prologika, LLC | Making Sense of Data
Microsoft Partner | Gold Business Intelligence

Upcoming Events

SQL Saturday: Building Dashboards with the MS BI Stack with Teo Lachev on May 18th
Atlanta BI Group: Data Warehouse Design Good Practices by Carlos Rodrigues on March 25th
Atlanta BI Group: Tableau BI by Jen Underwood on April 29th

Prologika Newsletter Winter 2012

What’s New in Excel 2013 and SharePoint 2013 BI

s13Microsoft released Office 2013 and SharePoint 2013 in October 2012. The logical question you might have is how the latest versions apply to your business intelligence needs. Here are some of the most important features that I believe might warrant your interest.


Excel 2013

The latest release reinforces the Excel status is the Microsoft premium BI tool on the desktop. The most exciting news is that Microsoft decoupled Power View from SharePoint and made it available in Excel 2013. Consequently, with a few clicks, a business user can create interactive ad-hoc reports in Excel 2013 from PowerPivot models, Tabular models, and soon from Multidimensional cubes.

When connecting to organizational models (Tabular and Multidimensional), users now can create their own calculations and use a new Timeline slicer that is specifically designed to work with dates. And, users can use Quick Explore in pivot reports to drill down a given cell and see its value is contributed by other subject areas.

On the self-service BI area, the most exciting news is that the xVelocity engine and PowerPivot now ships with Excel so users don’t have to download the PowerPivot add-in. Basic self-service BI tasks, such as importing data, joining tables and authoring pivot reports, can now be performed straight in Excel, although the PowerPivot features are still required to unleash the full PowerPivot capabilities, such as implementing calculations, visualizing relationships, and gaining more control over data import. Finally, users will undoubtedly enjoy the new Excel 2013 productivity features, such as Flash Fill to shape the data before analyzing it and Quick Analysis to jumpstart data analsys with recommended visualizations.

SharePoint 2013

On the SharePoint 2013 side of things, Excel web reports are now updatable. As a result, not only users can render pivot reports in HTML, but they can also change the report layout. Quick Explore is available in Excel web reports as well. PerformancePoint Services adds welcome enhancements, including theme support and better filtering.

As you know, the BI landscape is fast-moving and it might be overwhelming. If you have Software Assurance benefits, don’t forget that as a Microsoft Gold Partner and premier BI firm, Prologika can use your SA vouchers and work with you to help you plan and implement your BI initiatives, including:

  • Analyze your current environment and determine a vision for a BI solution
  • Define a plan to launch a BI reporting and analysis solution
  • Upgrading or migrating to SQL Server 2012

Regards,

Teo Lachev

Teo Lachev, MVP (SQL Server), MCSD, MCT, MCITP (BI)
Prologika, LLC | Making Sense of Data
Microsoft Partner | Gold Business Intelligence

News

Prologika obtained a Microsoft Silver Competency in Data Platform.
Prologika consultants have attended the SQL PASS SUMMIT conference in November.

Upcoming Events

Atlanta BI Group: Applied Enterprise Data Mining with Mark Tabladillo on Jan 28th
Atlanta BI Group: MDX vs DAX Showdown by Damu Venkatesan and Neal Waterstreet on Feb 25th
Atlanta BI Group: Data Warehouse Design Good Practices by Carlos Rodrigues on March 25th

Prologika Newsletter Q3 2012

Big Data

newsletter
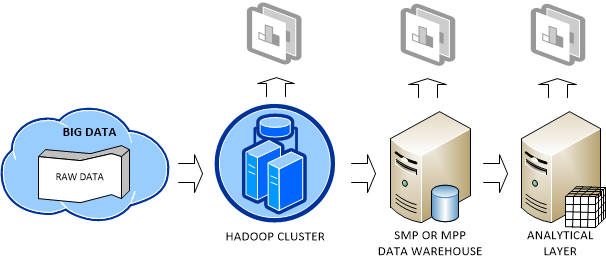
Big Data is getting a lot of attention nowadays. My definition of Big Data is a dataset (or a collection of datasets) that is so large that exceeds the capabilities of a single symmetric multiprocessing (SMP) server and traditional software to capture, manage, and process it within a reasonable timeframe. The boundaries of what defines a “large set” are always shifting upwards, but currently it’s the range of 40-50 terabytes.


Big Data can originate from various sources, including web logs (a popular website might generate huge log files), sensors (a motion sensor or temperature sensor, for example), devices (a mobile phone generates plenty of data as you move), and so on. Since data is the new currency of our times, you might not want to throw your data as someone might be willing to pay for it. However, Big Data means also a big headache. You need to decide how to store, manage, and analyze it. In general, the following deployment scenario emerges as a common pattern:

hadoop

As data accumulates, you might decide to store the raw data in the Hadoop fault-tolerant file system (HDFS). As far as cost, RainStor published an interesting study about the cost of running Hadoop. It estimated that you need an investment of $375 K to store 300 TB which translates to about $1,250 per terabyte before compression. I reached about the same conclusion from the price of single PowerEdge C2100 database server, which Dell recommends for Hadoop deployments.

Note I favor the term “raw data” as opposed to unstructured data. In my opinion, whatever Big Data is accumulated, it has some sort of structure. Otherwise, you won’t be able to make any sense of it. A flat file is no less unstructured than if you use it as a source for ETL processes but we don’t call it unstructured data. Another term that describes the way Hadoop is typically used is “data first” as opposed to “schema first” approach that most database developers are familiar with.

Saving Big Data in a Hadoop cluster not only provides a highly-available storage but it also allows the organization to perform some crude BI on top of the data, such as by analyzing data in Excel by using the Hive ODBC driver, which I discussed in my previous blog. The organization might conclude that the crude BI results are valuable and might decide to add them (more than likely by pre-aggregating them first to reduce size) to its data warehouse running on an SMP server or MPP system, such as Parallel Data Warehouse. This will allow the organization to join these results to conformant dimensions for instantaneous data analysis by other subject areas then the ones included in the raw data.

The important point here is that Hadoop and RDBMS are not competing but completing technologies. Ideally, the organization would add an analytical layer, such as an Analysis Services OLAP cube, on top of the data warehouse. This is the architecture that Yahoo! and Klout followed. See my Why an Analytical Layer? blog about the advantages of having an analytical layer.

The world has spoken and Hadoop will become an increasingly important platform for storing Big Data and distributed processing. And, all the database mega vendors are pledging their support for Hadoop. On the Microsoft side of things, here are the two major deliverables I expect from the forthcoming Microsoft Hadoop-based Services for Windows whose community technology preview (CTP) is expected by the end of the year: A supported way to run Hadoop on Windows. Currently, Windows users have to use Cygwin and Hadoop is not supported for production use on Windows. Yet, most organizations run Windows on their servers. Ability to code MapReduce jobs in .NET programming languages, as opposed to using Java only. This will significantly broaden the Hadoop reach to pretty much all developers.

Regards,

Teo Lachev

Teo Lachev, MVP (SQL Server), MCSD, MCT, MCITP (BI)
Prologika, LLC | Making Sense of Data
Microsoft Partner | Gold Business Intelligence

News

Microsoft awarded Teo Lachev with the Most Valuable Professional (MVP) award for SQL Server for eight years in a row. The Microsoft Most Valuable Professional (MVP) Award is Microsoft way of saying thank you to exceptional, independent community leaders who share their passion, technical expertise, and real-world knowledge of Microsoft products with others. There are less than 200 SQL Server MVPs worldwide.

Upcoming Events

Big Data and Hadoop with Atlanta BI Group on October 29th