Yet Another Relative Dates Implementation
Yet another relative dates implementation in an Analysis Services cube. So far, I’ve implemented two. But I’m now starting a project to implement an accounting (G/L) cube and the traditional relative date approach where each relative date is calculated for the current member in the Date dimension doesn’t fly anymore. Heck, the business analyst even found the excellent “Translating Cognos PowerPlay Transformer Relative Date Functionality into SQL Server Analysis Services (SSAS)” whitepaper by David Greenberg and told me that’s exactly what they need. That’s what happens when you have smart users. Power Pivot anyone? While the business users are not empowered yet, let me share how I implemented this approach.
What’s Needed?
The difference now is that we want to drill down from each relative date to the periods that the relative date spans. Let’s take a look at the screenshot below.
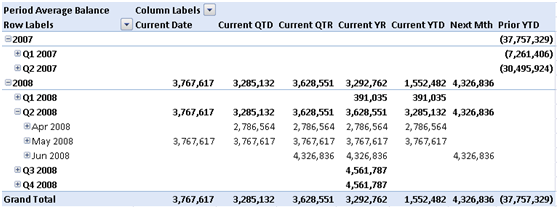
The cube sets the default member of the Date hierarchy to the accounting closing period, which is May 2008 in this case. The Current Date relative date shows the actual measure values for May 2008 only. The Current QTD shows the actual measure values for April and May 2008. The current QTR shows the actual measure values for April, May, and June, etc. In other words, when the user slices by Relative Dates and Date dimension, the system shows the actual measure values for the periods that belong to that relative date. Consequently, the only way for the user to get the calculated relative dates values, such as the Current YTD aggregate is to force the Date dimension to the [All] member but that’s fine with the business users.
Why We Disagree?
My implementation differs from the above-mentioned whitepaper in the following ways:
- I use a regular Relative Dates dimension instead of dimension calculated members that the SSAS BI Wizard and the whitepaper use. It looks to me that OLAP clients compete with each other to butcher dimension calculated members the most. Excel, for example, doesn’t retrieve calculated members by default and it doesn’t let you select individual calculated members. Other tools ignore them whatsoever. To avoid such pitfalls, I defined the Relative Dates dimension as a regular dimension.
- The whitepaper defines extra columns in the DimDate table that flag the qualifying dates. My implementation doesn’t do this because it’s not needed.
- The whitepaper produces the relative dates results by aggregating the measure across the qualifying date members. My approach uses simple scope assignments as you will see in a moment.
How This Got Implemented?
The implementation of this Relative Dates approach is remarkably simple.
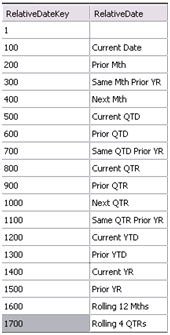
- Implement a SQL View on which the Relative Dates dimension will be based that hardcodes the Relative Dates members with SELECT…UNION statements. Note that first row on which will join the Date dimension doesn’t have a name because we will hide it in the next step.
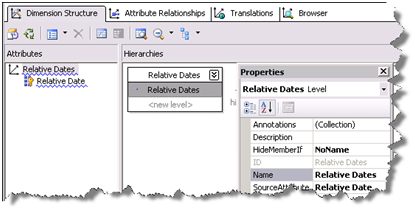
- Set up a Relative Dates dimension. Here I use a little trick to hide the first member because the user shouldn’t see it. Specifically, I set the AttributeHierarchyVisible of the Relative Date dimension key to False. Then, I created a Relative Dates hierarchy and set the HideMemberIf property of the Relative Dates level to NoName.

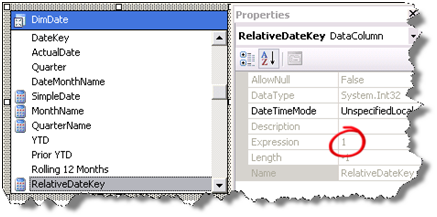
- I added a named calculation called RelativeDateKey to the DimDate table in the data source view with the expression value of 1 so I can relate the Relative Dates and Date dimensions.
- Next, we relate the Relative Dates dimension to all associated measure groups with a referenced relationship via the Date dimension.
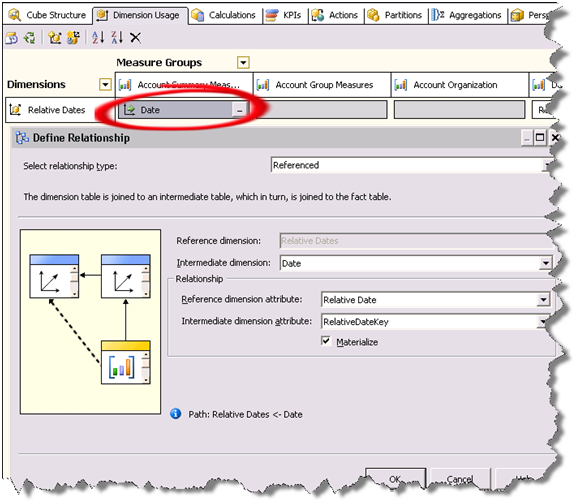
- Time for some MDX programming. We use script assignments to populate the Relative Dates cells. By default, all cells intersecting with all Relative Dates members (except for the RelativeDateKey member) are empty. So, we just need to “carry over” the measure values from the qualifying members of the Date dimension. Here is what the first three assignments look like:
— Current Date
Scope ([Relative Dates].[Current Date], [Date].[Date].DefaultMember);
this = [Relative Dates].&[1];
End Scope;
— Current QTD
Scope ([Relative Dates].[Current QTD], Exists(PeriodsToDate([Date].[Date Hierarchy].[Quarter], [Date].[Date Hierarchy].DefaultMember), [Date].[Date].[Date].Members));
this = [Relative Dates].&[1];
End Scope;
— Current QTR
Scope ([Relative Dates].[Current QTR], Exists(Descendants(Ancestor([Date].[Date Hierarchy].CurrentMember, [Date].[Date Hierarchy].[Quarter]), [Date].[Date Hierarchy].[Date]), [Date].[Date].[Date].Members));
this = [Relative Dates].&[1];
End Scope;
Prior to these assignments, the cube script sets the default member of the Date hierarchy to the accounting closing period. Each assignment scopes on the qualifying members of the Date dimension and sets the scope to [Relative Dates].&[1] , which as we’ve seen is the first member of the Relative Dates dimension.
Why Does This Work?
The script carries over the measure values to the Relative Date members that intersect with the members of the Date attribute hierarchy. From there on, the measure aggregation function kicks in to roll up the values, e.g. by month, year, and quarter.

