Using XPerf to Test Analysis Services
I have to admit that I am a performance buff. In a previous blog, I mentioned that the Xperf utility can help you gain additional understanding about the Analysis Services performance. Akshai Mirchandani from the SSAS team was kind enough to share his performance testing experience and recommended this utility. It turns out he was right – it is a real gem! Just after writing that blog, an opportunity presented itself. A business user complained that drilling down a member in an Excel PivotTable report takes about 20 seconds on a virtual test server. This inspired me to take XPerf for a spin. In this case, the database was relatively small but the user has requested two parent-child dimensions on the report with some 3,500 and 300 members each. As you probably know, parent-child dimensions are slow by nature. To make things worst both dimensions had many-to-many relationships. The SQL Profiler would show that almost the entire time was spent reading data from partitions. However, I was interested to find out how much time was spent in actual I/O vs. aggregating data to make specific performance recommendations. The findings were interesting. Here are the steps I followed to test the performance using XPerf on the virtual server running Windows Server 2008:
- I downloaded the Microsoft Windows SDK for Windows 7. Although it’s for Windows 7, it can run on Windows Server OS as well. When I ran the web install, I selected the Win32 Development Tools option only to reduce the size of the download.
- Once installed, I ran Install Windows Performance Tool Kit (x64) found in the Microsoft Windows SDK v7.0 -> Tools program group and accepted the default options.
-
I ran the command prompt with elevated privileges (Run As Administrator) and started a trace with the default configuration.
C:\Program Files\Debugging Tools for Windows (x64)>xperf -on DiagEasy - In Excel, I drilled down to expand a member of one of the parent-child dimensions that was particularly slow.
- Once Excel was done executing the query, I stopped the trace and saved the results in a file mytrace.etl.
C:\Program Files\Debugging Tools for Windows (x64)>xperf -d mytrace.etl
-
Double-clicked the mytrace.etl file which was saved in the C:\Program Files\Microsoft Windows Performance Toolkit folder to open in the Windows Performance Analyzer. This is where the fun starts!

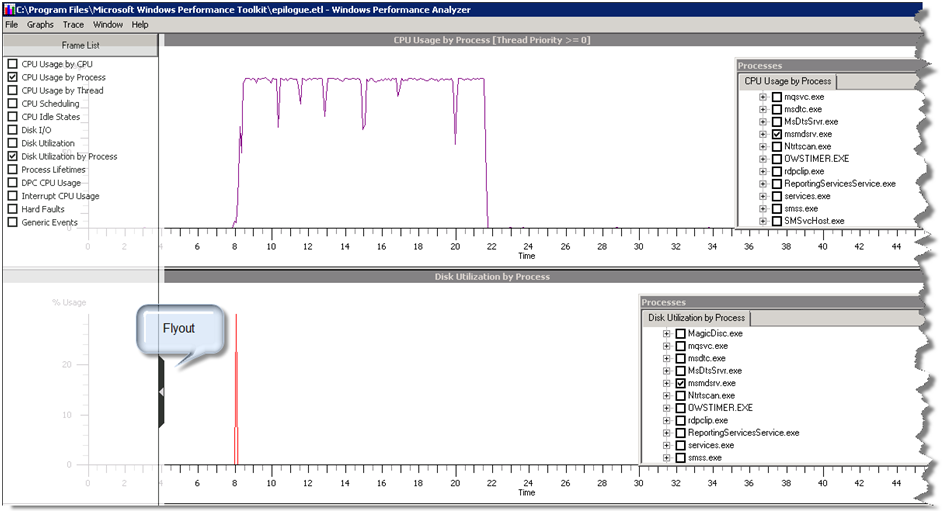
- Since I was interested in disk utilization and CPU usage, I clicked on the Flyout glyph and checked these options to have two graphs only.
-
On each graph, I expanded the Processes panel and left only msmdsrv.exe checked to filter the trace results for Analysis Services server only.
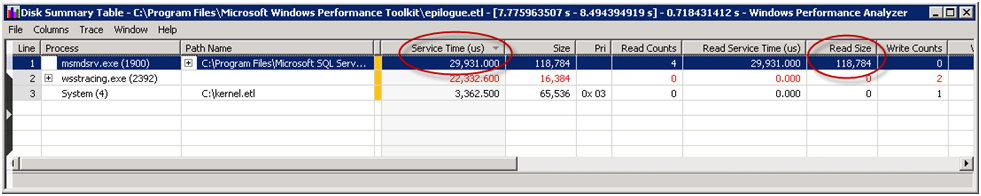
At this point, I couldn’t believe my eyes! As you could see, the server spent a fraction of a second to read from disk. The remaining time was spent in number crunching to aggregate the results. To see the actual metric, I selected the I/O peak, right-clicked and clicked Summary Table. This showed that the server spent 29ms to read only 118,784 bytes from disk which makes sense (as I said the database is small). In summary, this particular case could benefit much more from more CPU power and potentially more CPUs since the storage engine is highly parallel.
As you can see, Xperf can help you gain important performance details that are not available in SQL Profiler. In this blog, I only scratched the surface of what XPerf can do for you. One very interesting feature is stack walking that gives you a breakdown in time spent per function call assuming you have the debug symbols loaded. The stack waking feature is explained in more details in this Windows Performance Toolkit – Xperf blog. Of course, it could have been nice if the SQL Profiler gives you more detailed tracing information so you don’t have to rely on Xperf, e.g. Reading Data From Disk Begin/End, Data Cache Population Begin/End, Storage Engine Work Begin/End, Formula Engine Work Begin/End. So, vote here.