PerformancePoint Display Condition Not Working
Issue: A client reports an issue with our PerformancePoint dashboard where the clicking a KPI in the scorecard doesn’t show the supporting analytical grid. Normally, when the user clicks a row in the Operational Scorecard (see the image below), the SharePoint connectable architecture triggers an update of the Operational Detail Report Months analytical report that shows more details about the selected KPI.
Workaround: Finding the cause was tricky. To make things even trickier, the SQL Server Profiler would show “Query (1, 36) Parser: The syntax for ‘,’ is incorrect.” error so you would believe that there is something wrong with the MDX queries. This turned out to be an “innocent” error if there is such a thing. The reason for the issue with the report refresh not working was actually a PerformancePoint Display Condition bug presumably introduced by a recent SharePoint upgrade (more than likely the April CU). The display condition actually works if you put the page in Edit mode. While waiting for a fix from Microsoft, the workaround I found is to enable a default display condition:
- Open the dashboard in the Dashboard Designer.
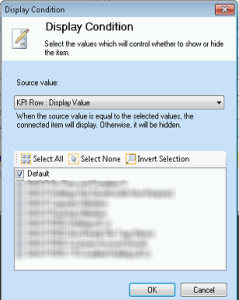
- In the Analytical Report web part, right-click the Display Condition and then Edit Condition.
- Check the Default checkbox and redeploy the dashboard.
This displays the default configuration of the Analytical Grid report which the user will see when opening the dashboard page. For some reason, this makes the KPI row clicks work. Sometimes, things get worse before getting better…


