One of trails my wife and I hiked today in the Acadia National Park was the Precipice Trail. This trail is considered one of the hardest trails in the United States. In fact, “hiking” is a misnomer as most of the ascent involves vertical rock climbing and pulling yourself up on iron rangs. Slipping and falling can surely result in a serious injury or death as there are no safety nets and there were such incidents in the past.
However, if you put yourself in the right mindset and prepare, you probably won’t find it that hard. In fact, we’ve found the descent more challenging than the ascent which we thought was exhilarating. And the Gulf of Main views were breathtaking!
How many ascents and views do we miss in life by not taking moderate risks?
I’ve been an independent consultant for almost 20 years and through most of this time, my company (Prologika) has been a Microsoft consultancy partner with Gold Data Analytics and Gold Data Platform competencies. Speaking of which, I’d like to thank all the wonderful people who have helped Prologika attain and maintain these competencies over the years by taking rigorous certification exams. I couldn’t have done it without you!
My simple definition of a consultant is an external expert whose services improve the client’s situation. Therefore, the most important criterion for measuring the consultant’s effectiveness is how much “lift” the client gets.
Effectiveness is rarely tangible because it’s difficult to measure. However, in the past, the second component (besides certifications) for maintaining the Microsoft partnership was providing customer references to Microsoft. I don’t think Microsoft ever called the customers but if they did, a simple question would have been “On the scale from to 1 to 10, how do you measure the Prologika’s intervention to improve the objective they were hired to do?” Or, “would you rehire or recommend Prologika?” That’s it, no fancy scores are necessary. Most often, the client is either happy or unhappy, although shades of gray might exist.
Fast forwarding to Microsoft modern partnership requirements and things have changed starting the beginning of this year where Microsoft introduced new criteria for measuring the effectiveness of their partners expressed as a “partner capability score” – “a holistic measurement framework which evaluates the partner on categories of performance, skilling and customer success”. Before we get to it, I find it sad that as a woke company positioned to defend minorities (see the Microsoft’s wokeness report), Microsoft has gone to great lengths to destroy its small-biz partner ecosystem over the years, including:
Favoring large “managed” partners.
Replacing the Microsoft Software Assurance consulting credits, where the client had the discretion how to spend and allocate, with revenue-centric Microsoft-managed funds which are almost impossible to get approved for, such as ECIF and PIE.
Replacing a designated Microsoft Partner Network point of contact with offshore outsourced service.
All the promises given and broken through years. Too many to mention here but it looks to me that every now and then some manager comes which a checklist of all great things Microsoft will do for partners and then all if forgotten or suffers a natural death.
Removing the Silver partner level.
Let’s now look at the new partner capability score for Data & AI, which spans three categories: performance, skilling, and customer success.
Performance – the partner must add up to 3 new customers every year. Apparently, Microsoft favors expansion of the customer base (more revenue) as opposed to doing recurring business to existing customers, which to me is by far a much better testimonial for effective services. But wait, there is a fine text explaining that not all customers are equal. “This is the number of unique customer tenants contributing at least $1000 ACR (Azure Consumed Revenue) in one of the last 2 months.” There we go. The emphasis is on selling more aggressively to customers.
Skilling – No surprises here. Microsoft wants a certain number of certified individuals. This is the only commonality with the old partner criteria.
Customer success – It quickly becomes evident that Microsoft equates “customer success” with revenue. Here we have two paths: number of deployments that depend on advanced Azure services represented in ACR (meaning expensive) and usage growth expressed as ACR growth across the customer base over the past 12 months.
There you have it. Microsoft now views partners as extension to their sales force that are pressured to sell and generate revenue to Microsoft. The more the partner sells, the better partner you are. Therefore, expect increased pressure from Microsoft partners to sell expensive products you probably don’t need, such as Power BI Premium or Fabric in the data analytics space.
The Microsoft VP who came up with this should have been fired on the spot. Gee, with all this focus on revenue, you might think that the partner gets some decent revenue cut, but that’s not the case. It doesn’t matter to me. I’m not making money from selling software and when I recommend a tool it’s always for the client’s best interest and my recommendation is usually very cost effective.
Given that my business values differ from the new Microsoft partnership values, I’m not planning to pursue further competency in the Microsoft partnership ecosystem. I’ll keep the hard earned and now retired Gold partner logo to remind me of what’s important. I’ll continue working with and recommending Microsoft products when it makes sense, such as when they are better from the competition, but without any strings attached.
For years users have been asking for Excel tables (not pivots) connected to SSAS so they can simply browse the data in a tabular format not subjected to the shortcomings of pivots. And for years Excel has been supporting just pivots that natively understand only SSAS OLAP cubes. Is Power BI changing things? Somewhat. Enter refined Excel connected tables. They look great on the surface. You go through a wizard that lets you select and filter your data and you get an Excel table connected to a Power BI dataset. Awesome, right?
Unfortunately, what’s missing is the Field List. To make the feature useful, the user should be able to access the Field List and remove, add, filter, as they can do with pivots. However, once the table is generated, to change it you either must go through the wizard again or change the DAX query (right-click the table, click Table, and then Edit Query). Down the DAX rabbit hole we go again…
As they stand, Excel connected tables are not an interactive browsing tool. Instead, they are geared towards making Power BI datasets accessible in Excel.
Since I lost hope that Excel will discover Tabular and DAX one day, I hope the community will step in to fill in the gap by providing UI like the Pivot Field List so that the user doesn’t need to mess with DAX when all that’s needed is an Excel connected table for ad-hoc data exploration.
I ranted many times about SaaS vendors preventing direct access to data in its native storage, which is typically a relational database. It’s sort of like going to a bank, handing them over your money, and they telling you that you can only get your money back in cash, in Bitcoin, in ₿100 bills but no more than ₿1,000 per withdrawal, or whatever madness suits the bank best. I wonder how long this bank will be in business. Yet, many companies just hand over the keys of the data kingdom to a SaaS vendor and they wonder how to get their “precious” back so they can build EDW and enable modern analytics. Since when direct access became an anathema perpetuated by mega software vendors, including Microsoft? I’ll repeat again that there are no engineering reasons to prevent direct access to your data, even if you must pay more to “isolate” you from other customers for security, performance, liability, or other “tradeoffs” for you choosing the SaaS path.
However, there are rays of sunshine here and there. In a recent integration project, I had to extract data from the InTempo ERP cloud software. Besides other integration options, InTempo supports ODBC access to their IBM Db2 database over VPN connectivity. Not only did InTempo give us direct access to the ERP data, but they also provided support services to help with the SQL queries. I couldn’t believe my luck. Finally, an enlightened vendor! On the downside, we had to send freeform SELECT statements down the wire from ADF while I personally would have preferred an option to package them in SQL views residing at the database, but I’d be pushing my luck.
Direct access to your data should be on top of your SaaS vendor selection criteria. TIP: if you hear “API” in any flavor (REST, ODATA, SOAP, etc.), run for the exit. I have nothing but horrible experience taking that path, even with Microsoft Dynamics APIs. “Data lake” is a tad better but still your best option is direct access to data in its native storage to avoid excessive integration effort and reduce data latency.
Atlanta BI fans, please join us for the next meeting on Monday, September 11th, at 6:30 PM ET. Shabnam Waston (BI Consultant and Microsoft MVP) will introduce us to the Lakehouse engine in Microsoft Fabric. Shabnam will also sponsor the meeting. Your humble correspondent will help you catch up on Microsoft BI latest. For more details and sign up, visit our group page.
PLEASE NOTE A CHANGE TO OUR MEETING POLICY. WE HAVE DISCONTINUED ONLINE MEETINGS VIA TEAMS. THIS GROUP MEETS ONLY IN PERSON. WE WON’T RECORD MEETINGS ANYMORE. THEREFORE, AS DURING THE PRE-PANDEMIC TIMES, PLEASE RSVP AND ATTEND IN PERSON IF YOU ARE INTERESTED IN THIS MEETING.
Presentation: Introducing Lakehouse in Microsoft Fabric
Delivery: Onsite
Date: September 11th
Time: 18:30 – 20:30 ET
Level: Beginner to Intermediate
Food: Sponsor wanted
Agenda:
18:15-18:30 Registration and networking
18:30-19:00 Organizer and sponsor time (events, Power BI latest, sponsor marketing)
19:00-20:15 Main presentation
20:15-20:30 Q&A
VENUE
Improving Office 11675 Rainwater Dr Suite #100 Alpharetta, GA 30009
Overview: Join this session to learn about Lakehouse architecture in Microsoft Fabric. Microsoft Fabric is an end-to-end big data analytics platform that offers many capabilities including data integration, data engineering, data science, data lake, data warehouse, and many more, all in one unified SaaS model. In this session, you will learn how to create a lakehouse in Microsoft Fabric, load it with sample data using Notebooks/Pipelines, and work with its built-in SQL Endpoint as well as its default Power BI dataset which uses a brand-new storage mode called Direct Lake.
Speaker: Shabnam Watson is a Business Intelligence consultant, speaker, blogger, and Microsoft Data Platform MVP with 20+ years of experience developing Data Warehouse and Business Intelligence solutions. Her work focus within the Microsoft BI Stack has been on Analysis Services and Power BI and most recently on Azure Synapse Analytics. She has worked across several industries including Supply Chain, Finance, Retail, Insurance, and Health Care. Her areas of interest include Power BI, Analysis Services, Performance Tuning, PowerShell, DevOps, Azure, Natural Language Processing, and AI. She is a regular speaker and volunteer at national and local user groups and conferences. She holds a bachelor’s degree in computer engineering and a master’s degree in computer science.
Sponsor: Shabnam Watson
https://prologika.com/wp-content/uploads/2016/01/logo.png00Prologika - Teo Lachevhttps://prologika.com/wp-content/uploads/2016/01/logo.pngPrologika - Teo Lachev2023-09-05 17:01:182023-09-05 17:01:18Atlanta Microsoft BI Group Meeting on September 11th (Introducing Lakehouse in Microsoft Fabric)
Currency conversion is a common requirement, such as when implementing analytics on top of ERP sales data recorded in multiple currencies. The most flexible approach is to allow the user to select a currency and perform the conversion at runtime, ideally by centralizing the conversion code in Power BI calculation groups. However, this approach has several shortcomings:
Based on my experience, the most common requirement is to convert to a single corporate currency, such as USD, but provide the foreign subsidiaries an option to see the data in their local currency, such as for testing that the DW data is accurate. Therefore, the user should be presented with a slicer (or filter) with only two options: USD and Local. In the case of USD, all monetary measures will be converted to USD. In the case of Local, no conversion is needed.
Centralizing the code in a calculation group won’t work with only USD and Local options, because you won’t be able to obtain the context (currency and date) for multiple fact tables and do the lookup.
It incurs some performance hit to look up the exchange rate and check additional conditions.
If you decide to centralize the code in a calculation group, you must filter which measures require conversion.
So, I take the middle path based on the following implementation points:
I import the currency exchange rate that the Finance department uses in the data warehouse. Although the ERP system might store the exchange rate for each transaction, this is typically not the exchange rate Finance uses for the conversion.
In SQL views that wrap the fact tables, I look up the rate based on the currency and data for each row, such as for each invoice line item. Consequently, the rate is readily available when the data is imported in Power BI and no runtime lookup is necessary.
Since I use measure “wrappers” for each measure anyway, the actual conversion is done in the DAX measure, such as:
ReportCurrency could be implemented as a calculation group although it could also be a regular table. I opt for a calculation group in case I need to do something with the format string. Of course, the easiest solution is to format monetary measures as decimals without any currency symbol. The _ReportCurrency variable stores the option selected by the user. In case the user has selected “Local”, the IF expression returns 1 (no conversion is required); otherwise, it gets the exchange rate stored on the record. Finally, the formula divides the based measure (renamed to GrossSalesBase by the exchange rate (in this case, the exchange rate is a divisor) for each row in the table, and then sums up the result.
To recap, I believe this approach is simpler, faster, and more aligned with what you’ll encounter as requirements. On the downside, some code is repeated in each monetary measure.
Poor data quality is one of the most challenging hurdles for successful data analytics. The story typically goes like this. The client has a flexible line of business system that people tend to use and abuse, such as entering garbage in free-form text fields that shouldn’t be free-form to start with. There is no data stewardship or data entry oversight. I’m not blaming anyone because people go about their business trying to get something done as fast as possible and BI is not on their minds. The issue is further complicated by acquisitions that usually bring more systems and more garbage. You and I’ve been there…the bigger and more complex the organization, the bigger the mess.
How do we solve this challenge? Should we buy a super-duper master data management (MDM) system to solve the data quality mess? Or should we kick the can down the road and tackle data quality in downstream systems, such as the data warehouse? In some cases, MDM can help but based on my experience, MDM systems are usually unnecessary. First, solving data quality issues down the road is probably a bad idea. Second, MDM systems bring additional complexity. ETL needs to be implemented to bring the data in and out, a business user must be delegated to correct data issues, another system needs to be learned and maintained, not to mentioned licensing costs. Instead, what’s really needed is to address data quality as upstream as possible, and that is the main data sources, such as the ERP system. The process is simple but tedious. Here are a few steps to get your team started on that road:
Start by cleaning up the hierarchies because they are fundamental for top-level analysis. Request Management to come up with a standardized nomenclature in the form of hierarchies. What do we want our product hierarchy (Product Category, Subcategory,…) to look like? What do we want the Customer hierarchy to look like? Geography? Organization?
Identify major data quality issues that deviate from the standard nomenclature.
For each issue, determine how to address the issue. Can it be fixed by overwriting the data entry or coming up with a new custom field? Can the changes be automated or done in bulk, such as updating the underlying table directly? For example, if the country is misspelled, the best solution will be to go that invoice or customer and change the country. Or, if a certain hierarchy member is completely missing, such as continent or territory, add a new custom field.
Assign the list of the data entry issues identified in step 2 to a data entry person to fix. Or, if they can be fixed in bulk, such as by updating the underlying tables, ask your helpful DBA to make the changes.
If possible, ask the developer in charge to modify the source system to improve data quality, such as by using dropdowns instead of free-form entries for important fields and adding data entry rules.
I know this might be too simplistic. For example, the ERP might disable data entries once an invoice is approved, and I’ve seen clients adding data correction tables in data marts to get around this. If updating the data directly in the underlying tables is an option, this might be your best bet. However, if compliance or other regulations prevent this from happening, then the data must be fixed outside.
However, the main principle remains that data quality must be tackled as close to the source as possible. And improving data quality is your best investment and prerequisite to enable effective data analytics.
I’ve done a few BI integration projects extracting data from ERPs running on IBM Db2. Most of the implementations would use a hybrid architecture where the ERP would be running on an on-prem mainframe while the data was loaded in Microsoft Azure. Here are a few tips if you’re facing this challenge:
IBM provides JDBC, ODBC, and OLE DB drivers. The JDBC driver is not applicable to the Microsoft toolset because none of the Microsoft BI tools run on Java runtime. Microsoft provides an OLE DB Provider for Db2.
If you use Azure Data Factory or Power BI Desktop, you can use the bundled Microsoft OLE DB driver for Db2. Here are the Azure Data Factory settings for setting up a linked service using the Db2 driver:
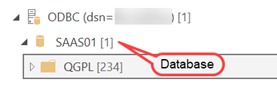
Server name – specify the server name of IP address of the IBM Db2 server. For DB2 LUW the default port is 50000, for AS400 the default port is 446 or 448 when TLS enabled. Example: erp.servername.com:446 to connect to AS400.
Database name – that one is tricky as I’ve found that even the client doesn’t know it because the ODBC/JDBC driver hides it. The easiest way to obtain it is to connect Power BI Desktop to Db2 using the ODBC driver and look at the Navigator window.
Package collection: This one can get you in trouble. If you get an error “The package corresponding to an SQL statement execution request was not found. SQLSTATE=51002 SQLCODE=-805”, enter NULLID as explained in the ADF documentation (see the link above).
To use the IBM drivers, you need to install them on the on-prem VM hosting the ADF self-hosted runtime. Instead, consider using the Microsoft-provided drivers because they are bundled with the runtime and there is nothing for you to install.
Based on my tests, all drivers have similar performance but do upgrade to the latest IBM drivers if you plan to use them. In one project, I’ve found that the latest IBM ODBC driver outperformed twice an older driver the client had.
The read throughput is going to be mostly limited by the mainframe server itself and the connection bandwidth between the data center and Azure. In all projects, the mainframe read speed was by far slower than reading data from a modest SQL Server. For example, one project showed that it would take 2.5 minutes to read one million rows from the production mainframe, while it would take 40 seconds to read the same data from SQL Server.
While optimizing the mainframe performance will likely be outside your realm of possibilities, you could lobby to increase the connection throughput between the data center and Azure if you plan to transfer a lot of data. Aim for 500 Mbps or higher. For example, after 2.5 minutes to read aforementioned 1 million row dataset from the server, it took another 2.5 minutes to transfer the data (about 2.5 Gb) to Azure because the connection throughput for this project was only 100 Mbps.
https://prologika.com/wp-content/uploads/2016/01/logo.png00Prologika - Teo Lachevhttps://prologika.com/wp-content/uploads/2016/01/logo.pngPrologika - Teo Lachev2023-08-12 16:55:322023-08-12 16:55:32Top 5 Lessons Learned from IBM Db2 Integration Projects
This took a while to figure out…so someone might find it useful.
Scenario: You have set up two Azure Data Factory instances for DEV and PROD environment. The DEV environment uses a self-hosted integration runtime to read data from on-prem data sources. The day has come to deploy your masterpiece to PROD. You share the DEV self-hosted runtime with the production ADF instance. You export the ADF ARM template and attempt to run it against the pristine PROD environment. You’re greeted with DataFactoryPropertyUpdateNotSupported error. The “property” here is linked self-hosted runtime.
Solution: The following solution worked for me. In your ARM template, scroll all the way to the bottom and add the following to the typeProperties element of the self-hosted runtime:
IMPORTANT: Make sure that in your production ADF, you have created a shared self-hosted runtime that points to the one in your DEV environment before you proceed with the ARM template deployment.
{
   "type": "Microsoft.DataFactory/factories/integrationRuntimes",
   "apiVersion": "2018-06-01",
   "name": "[concat(parameters('factoryName'), '/mtx-adf-shir-us')]",
   "dependsOn": [],
   "properties": {
       "type": "SelfHosted",
       "typeProperties": {
           "linkedInfo": {
               "resourceId": "Resource ID obtained when you share the self-hosted runtime in DEV",
               "authorizationType": "Rbac"
           }
       }
   }
}
Atlanta BI fans, please join us for the next meeting on Monday, August 7th, at 6:30 PM ET. James Serra (Data & AI Solution Architect at Microsoft) will join us remotely to introduce us to Microsoft Fabric. For more details and sign up, visit our group page.
PLEASE NOTE A CHANGE TO OUR MEETING POLICY. WE HAVE DISCONTINUED ONLINE MEETINGS VIA TEAMS. THIS GROUP MEETS ONLY IN PERSON. WE WON’T RECORD MEETINGS ANYMORE. THEREFORE, AS DURING THE PRE-PANDEMIC TIMES, PLEASE RSVP AND ATTEND IN PERSON IF YOU ARE INTERESTED IN THIS MEETING.
Presentation: Introducing Microsoft Fabric
Delivery: Speaker will join us remotely via Teams
Date: August 7th
Time: 18:30 – 20:30 ET
Level: Beginner
Food: Sponsor wanted
Agenda:
18:15-18:30 Registration and networking
18:30-19:00 Organizer and sponsor time (events, Power BI latest, sponsor marketing)
19:00-20:15 Main presentation
20:15-20:30 Q&A
ONSITE
Improving Office 11675 Rainwater Dr Suite #100 Alpharetta, GA 30009
Overview: Microsoft Fabric is the next version of Azure Data Factory, Azure Data Explorer, Azure Synapse Analytics, and Power BI. It brings all these capabilities together into a single unified analytics platform that goes from the data lake to the business user in a SaaS-like environment. Therefore, the vision of Fabric is to be a one-stop shop for all the analytical needs for every enterprise and one platform for everyone from a citizen developer to a data engineer. Fabric will cover the complete spectrum of services including data movement, data lake, data engineering, data integration and data science, observational analytics, and business intelligence. With Fabric, there is no need to stitch together different services from multiple vendors. Instead, the customer enjoys end-to-end, highly integrated, single offering that is easy to understand, onboard, create and operate.
This is a hugely important new product from Microsoft, and I will simplify your understanding of it via a presentation and demo.
Speaker: James Serra works at Microsoft as a big data and data warehousing solution architect where he has been for most of the last nine years. He is a thought leader in the use and application of Big Data and advanced analytics, including data architectures, such as the modern data warehouse, data lakehouse, data fabric, and data mesh. Previously he was an independent consultant working as a Data Warehouse/Business Intelligence architect and developer. He is a prior SQL Server MVP with over 35 years of IT experience. He is a popular blogger (JamesSerra.com) and speaker, having presented at dozens of major events including SQLBits, PASS Summit, Data Summit and the Enterprise Data World conference. He is the author of the upcoming book “Deciphering Data Architectures: Choosing Between a Modern Data Warehouse, Data Fabric, Data Lakehouse, and Data Mesh”.
https://prologika.com/wp-content/uploads/2016/01/logo.png00Prologika - Teo Lachevhttps://prologika.com/wp-content/uploads/2016/01/logo.pngPrologika - Teo Lachev2023-08-01 11:13:522023-08-01 11:13:52Atlanta Microsoft BI Group Meeting on August 7th (Introducing Microsoft Fabric)