Drilling Through in Power BI
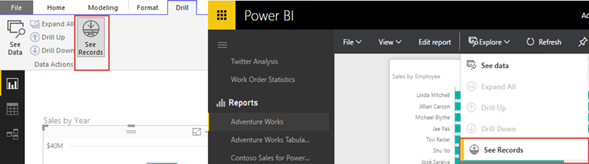
Excel users are familiar with drilling through details by double-clicking a cell in a PivotTable report or PivotChart data point. Power BI has silently added a similar feature to let users see the level of detail behind a chart data point in both Power BI Desktop and Power BI Service. This option can be enabled per visual by turning on the See Records option in Power BI Desktop or the same option from the Explore menu when viewing a report in powerbi.com. Interestingly, it’s also available when you right-click a data point in Power BI Desktop (this is the first time I’ve seen a context menu to work in Power BI).
Once you enable it, clicking on a chart data point doesn’t trigger interactive highlighting (the default behavior). Instead, it navigates you to a new page that auto-generates a Table report whose filters inherit the filters on the main report. Interestingly, drilling through works even the main report has a multi-valued filter (it took Excel all the way to 2016 to support multi-valued filters for drilling through).
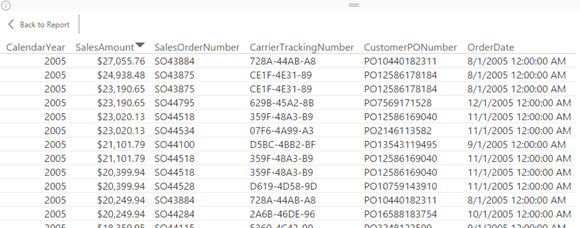
I think Power BI defaults to 1,000 rows by default and I don’t see a way to change this limit. It the drillthrough action results in more rows, a warning icon is displayed in the upper left corner of the report. It’s not clear how Power BI preselects which columns to show in the drillthrough report but you can always use the Fields list to add/remove fields. That’s another great feature that Excel drillthrough didn’t support and required custom SSAS actions to support. Also, instead of auto-generated field captions the report shows the actual field names (another welcome feature that Excel doesn’t support). Unfortunately, currently Power BI doesn’t support drilling through cells in Tabular and Matrix reports.
Power BI “See Records” feature adds drilling-through capabilities to chart and map visuals to allow users to see the rows that contribute to the aggregated value. Users would love this feature as it’s more versatile than Excel drill-through and completely missing in Power View reports.


