Geocoding with Power View Maps
As I wrote before, Power View in Excel 2013 and SharePoint with SQL Server 2012 SP1 supports mapping. The map region supports geocoding and it allows you to plot addresses, countries, states, etc, or pairs of latitude-longitude coordinates. The key for getting this to work is to mark the columns with appropriate categories.
- Using latitude-longitude
If you have a SQL Server table with a Geography data type, you can extract the latitude and longitude as separate columns.
SELECT SpatialLocation.Lat, SpatialLocation.Long FROM Person.Address
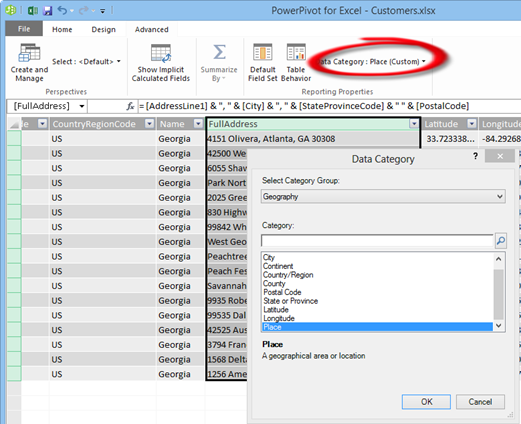
Once you import the dataset in PowerPivot, make sure to categorize the columns using the Advanced tab.

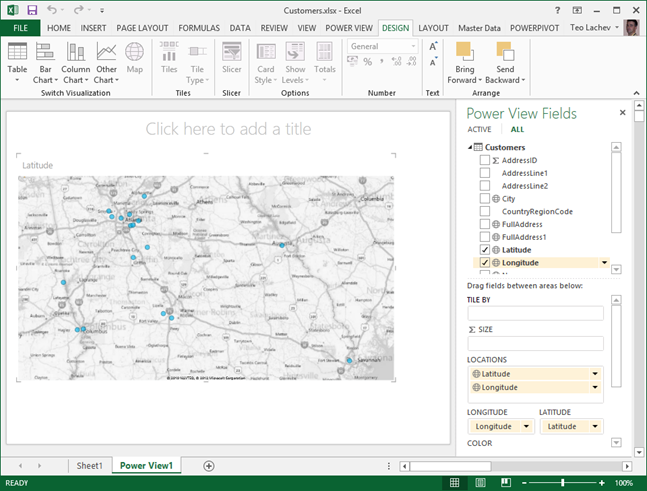
The map region doesn’t support grouping on latitude-longitude so you can’t just place them in the Latitude-Longitude zones and expect it work. Instead, you have to add another field, such as address or both the Latitude-Longitude combination to the Location field. The map groups on the Location zone but uses the Latitude and Longitude to place the points.
- Address geocoding
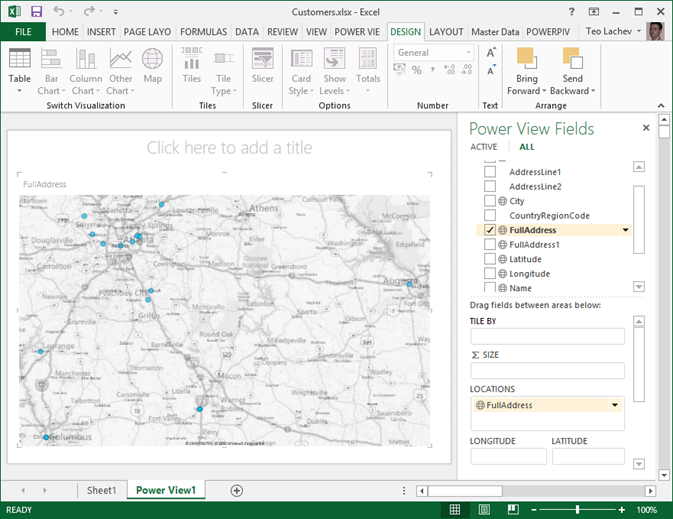
If you don’t have Latitude-Longitude, the map is capable of geocoding full addresses. Again, the trick here is to categorize the FullAddress column as Address. However, if you have invalid addresses, you’ll find that the map won’t show them. Instead, categorize the column as Place, which you can find in the More Categories section (thanks to Sean Boon from the Reporting Services team for the tip).

The map passes to Bing the fact that the field is mapped as Address so it should plot whatever we get back from Bing. The Bing Maps web experience isn’t identical to the API as you can’t pass the Address hint to Bing in the web experience. The Place category is more liberal in terms of what it will attempt to plot.