Posts

The Best Self-Service BI Tools of 2015

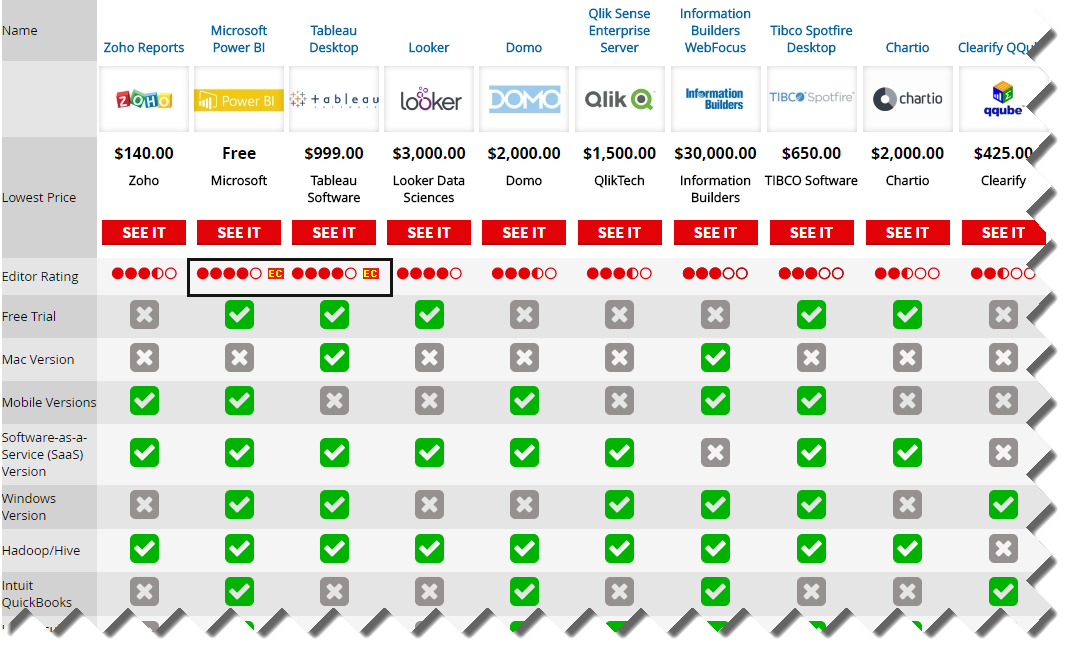
I came across this interesting PC Magazine article that just came up to compare 10 popular self-service BI tools. And the winner is? Power BI, of course, rubbing shoulders with Tableau for the Editor Choice award! The author, David Strom, did a great job reviewing the tools (this is not a trivial undertaking) but a few Power BI conclusions deserve clarifications:

  • Cons: “Cloud version has a subset of features found in Windows version” – The cloud version is meant to be simple on purpose so that business users can start analyzing data without any modeling.
  • Sharing: “Microsoft relies on the shared Microsoft OneDrive at Microsoft cloud service (or what it calls a “content pack”) to personalize and share your dashboard and reports via unique URLs” Power BI doesn’t rely on OneDrive for collaboration. Instead it supports three ways to share content: simple dashboard sharing, workspaces, and content packs.
  • Custom visuals: “You can get quickly up to speed by searching through an online visualizations gallery to find the particular presentation template you want to use to show your data. This is the reverse of what many BI tools such as Tableau Desktop ($999.00) at Tableau Software and Domo ($2,000.00) at Domo have you do, and it takes a bit of getting used to.” Not sure what this refers to. There are built-in visualizations and starting up with them is no different than using other tools. But we have also custom visuals that no other vendor has.
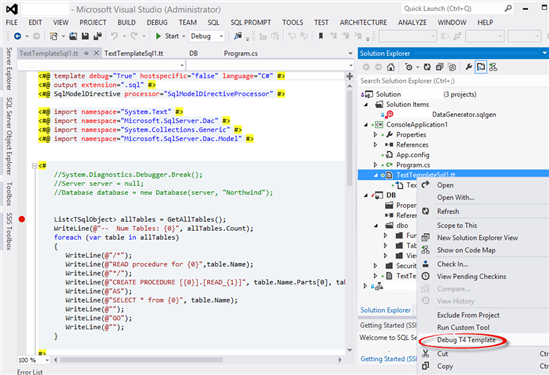
  • Custom visuals:” A new section called “Developer Tools” lets you build custom visualizations using a Visual Basic-like scripting language that is documented in a GitHub project. While it is still in beta, it could be a very powerful way to add your own custom look to your dashboards” The Dev Tools for implementing custom visuals outside Visual Studio is in preview but the actual visualization framework is not. And developers use TypeScript (superset of JavaScript) and not Visual Basic.

Speaking about reviews, here are some important Power BI characteristics that make it stand above the rest of the pack:

  1. Data engine and DAX – no other tool can come close to the Power BI in-memory engine that allows data analysts to build data models that are on a par with professional models.
  2. Hybrid architecture that allows to connect your visualizations to on premise data sources.
  3. Self-service ETL with Power Query – as far as I know, no other tool has such capabilities.
  4. Open architecture that allows developers to extend the Power BI capabilities
  5. Great value proposition that follows the freemium model – Power BI Desktop is free, Power BI Mobile is free, Power BI service is mostly free.

pcmag

Microsoft Unveils BI Roadmap

Today at the SQL PASS Summit 2015, Microsoft shared its BI roadmap for next year and beyond. The BI cloud roadmap shouldn’t be a surprise to anyone. It’s centered around Power BI. The main takeaway about the on-premises roadmap is deemphasizing the role of SharePoint and Office in favor of Reporting Services. In SQL Server 2016, SSRS will be extended to support Datazen reports. A future SQL Server update would support publishing Power BI Desktop files as well.

“Just as we’ve added mobile report delivery to SSRS in SQL Server 2016, we intend to add governed Power BI Desktop report delivery in the future.”

Although this news will surely cause some commotion in a short term, I believe it’s a good news for customers and BI practitioners in a long term. For customers, you no longer need SharePoint and SQL Server Enterprise licenses if all you need is sharing some reports and dashboards. So, this move brings significant cost savings in both software licenses and operational expenses. However, if you have invested in SharePoint you can continue using its BI features in SharePoint Server 2013 and beyond. For BI practitioners, you no longer need to deal with SharePoint complexities. MVP and the community have been asking for years for a simplified deployment model and now we have it. And removing SharePoint and Office dependencies will remove adoption barriers caused by aligning release cycles across different Microsoft product groups.

I’m personally glad that SSRS was chosen as the workhorse of the on-premises BI roadmap. SSRS is a mature product and it’s a natural choice to step up to its new role. Apparently, it’s not trivial to decouple the Power BI Service from all the Azure backend infrastructure so we can host it on premises. Long live SSRS!

About Gartner Magic Quadrant 2015 for BI

The 2005 Gartner Magic Quadrant is out and according to Gartner, the distance between Tableau and the other leaders is widening. Here is the full report. It’s obvious that Gartner focuses only on the self-service aspect of BI and throws away the entire gamut of tools required to deliver successful BI solutions, including RDBMS, ETL, data models, MDM, etc. But even if we focus on self-service BI, I don’t quite agree with Gartner’s infatuation with Tableau (see my blog “Top 10 Reasons for Choosing Microsoft Self-service BI”). It’s a good visualization tool but based on what I hear, people tend to overestimate its capabilities and get in trouble. Nevertheless, for the most part I agree with the Gartner’s assessment related to Microsoft BI cautions, except:

1. “Microsoft had the highest percentage of customer references citing absent or weak functionality (for example, no drill-through capabilities in Power View) as a platform problem.”

Really? The other vendors have more functionality? Can Tableau import multiple datasets, transform data, have Q&A, scale, share and discover datasets, or have data governance? And, that percentage is probably high, because the percentage of customers using Microsoft BI is high.

2. “However, customers may have difficulty finding external resources with experience in the newer Power BI stack, which requires a different set of skills and expertise than Microsoft’s sweet spot of systems-of-record, developer-focused BI deployments.”

The Power BI stack shouldn’t require that much knowledge.

A successful BI strategy should be much more than just “putting lipstick on a pig”. No matter how nice the lipstick is, it’s still a pig. However, the Gartner’s summary of the Microsoft weaknesses is spot on:

“Microsoft is attempting to address many of these limitations in the forthcoming stand-alone version of Power BI, which does not require Office 2013 or an Office 365 subscription and can access Analysis Services structures and content without physically moving underlying enterprise data to the cloud.”

I’m looking forward to the 2016 quadrant. For now, I like better the Forester Research report (http://www.forrester.com/pimages/rws/reprints/document/115485/oid/1-RN6A25).

022515_0242_AboutGartne1

3 Techniques to Save BI Implementation Effort

Everyone wants to press a button and have the entire BI system generated and ready to go. But things are not that simple. You know it and I know it. Nevertheless, BI automation tools are emerging with growing promises that propelled them to the Top 10 BI Trends according to the Information Management magazine. As a side note, it was interesting that the same article put Big Data in the No 1 spot despite that Gartner deemphasized the Big Data hype (based on my experience and polling attendees to our BI group meetings, many don’t even know what Big Data is). While I don’t dismiss the BI auto-generators can bring some value, such as impact analysis and native support of popular systems, such as ERP systems, there are also well known cautions, include vendor lock-in, a new toolset to learn, suboptimal performance, supporting the lowest feature denominator of targeted database, etc. However, you don’t have to purchase a tool to save redundant implementation effort. Instead consider the following techniques:

  1. Use the ELT (extraction, load, and transform) pattern instead or ETL (extract, transform, and load). While different solutions require different patterns, the ETL pattern is especially useful for data warehouse implementation because of the following advantages:
    1. Performance – Set-based processing for complicated lookups should be more efficient than row-by-row processing. In SQL Server, the cornerstone of the ETL pattern is the T-SQL MERGE statement which resolves inserts, updates, and deletes very efficiently.
    2. Features – Why ignore over two decades of SQL Server evolution? Many things are much easier in T-SQL and some don’t have SSIS counterparts.
    3. Maintenance – It’s much easier to fix a bug in a stored procedure and give the DBA the script than asking to redeploy a package (or even worse a project now that we’ve embraced the project model in SSIS 2012).
    4. Upgrading – As we’ve seen, SQL Server new releases bring new definitions that in many cases require significant testing effort. Not so with stored procedures.
    5. Scalability – if you need to load fact tables, you’d probably need to do partitions switching. This is yet another reason to stage data first before you apply transformations.
  2. Automate the generation of stored procedure. The ELT pattern relies heavily on stored procedures. If you have to populate a lot of tables, consider investing some upfront development effort to auto-generate stored procedures, such as by using the Visual Studio Text Templates (also known as T4) templates. Note that to be able to debug them in Visual Studio 2012, you would need to add the template to a .NET project, such as a console application.

5415.2014-05-10_19-22-41.png-550x0

3.  Automate the generation of SSIS packages. If you embrace the ELT pattern, your SSIS packages will be simple. That’s because most of the ELT code will be externalized to stored procedures and you would only use SSIS to orchestrate the package execution. Yet, if you have to create a lot of SSIS packages, such as to load an ODS database, consider automating the processing by using the Business Intelligence Markup Language (BIML) Script. BIML is gaining momentum. The popular BIDS Helper tool supports BIML. And, if you want to take BIMS to the next level, my friends from Varigence has a product offering that should help.

SQL Server Events in Atlanta

Next week will be SQL Server-intensive and your humble correspondent will be heavily involved:

  • Monday, April 28th: Power BI presentation by Brian Jackson, Microsoft for Atlanta MS BI Group with Pyramic Analytics sponsoring the event. This presentation will cover new and compelling Power BI features including: the data manipulation of Power Query, Power BI Sites, the Data Steward Experience, natural language BI using Power Q&A, and mobile BI functionality. There will also be a technical discussion of the Power BI architecture as it relates to authentication, storage, data refresh and the concept of self-service information management.
  • Friday, May 2nd: Three SQL Saturday precon sessions (Deep Dive into the Microsoft BI Semantic Model by Teo Lachev, SQL Performance Tuning & Optimization by Denny Cherry, and What the Hekaton!? A Whole New Way to Think About Data Mgmt by Kalen Delaney). Ping Stuart Ainsworth on Twitter at @codegumbo for $20 discount!
  • Saturday, May 3rd: SQL Saturday – a full day event of top-notch SQL Server sessions. Last year we had a worldwide record attendance with some 570 people attending the event. Help us to top it off this year!

Besides the BISM precon, I’ll do a session a SQL Saturday “Predictive Analytics for the Data Scientist and BI Pro” on May 3rd at 8:15.

“The time for predictive analytics to go mainstream has finally come! Business users and BI Pros can use the Microsoft SQL Server and Microsoft Office to unleash predictive analytics and unlock hidden patterns. Join this session to learn how a data scientist can use the Excel Data Mining add-ins to perform predictive analytics with Excel data. I’ll provide also the necessary fundamentals for understanding and implementing organizational predictive models with Analysis Services.”

042214_1235_SQLServerEv2

Where is Your Focus?

With all the tremendous interest around BI, new vendors and tools are emerging almost every day. In general, you can approach your BI needs in two ways.

  1. You can try a top-down approach starting with the presentation layer, hoping that a cool data visualization tool and self-service BI will somehow solve your challenges. Lots of vendors out there would love to take you on that path.
  2. You can follow a bottom-up approach that starts with a solid data foundation and semantic layer that enables a single version of the truth and it is supported by most popular visualization tools.

I had the pleasure to teach a class this week for the HR department of one of the largest and most successful companies. They have an ambitious goal to establish a modern data analytics platform in order to gain insights into all aspects of their workforce. Their manager told that they have tried unsuccessfully the top-down approach and multiple vendor tools until they realized that the focus should be on the data first. And, I agree completely. There are no shortcuts.

On this note, join me for a full-day precon session “Deep Dive into the Microsoft BI Semantic Model (BISM)” at SQL Saturday Atlanta on May 2st to find out how the Microsoft BI helps you deliver a modern BI platform, as well as discussing the toolset strengths and challenges.

KPIs on Smartphone

Some of your might be familiar with the PushBI mobile BI offering of Extended Results. The company was recently acquired by Tibco. Now rebranded as Tibco Spotfire Metrics, its mobile BI offering is now available for the most popular mobile platforms, including Windows Phone and Windows 8. As its documentation explains, Spotfire Metrics supports surfacing KPIs from a variety of data sources, including Analysis Services. If you’re looking for ways to present KPIs to mobile phones, Spotfire Metrics could fill in the gap.

030214_2329_KPIsonSmart1

Gartner’s Magic Quadrant for Business Intelligence and Analytics Platforms 2014 Released

Gartner released the 2014 update of the Business Intelligence and Analytics Platforms Magic Quadrant. Interestingly, Gartner moved the predictive capabilities to a new Magic Quadrant for Advanced Analytics Platforms and dropped scorecards. The most interesting aspect of this report for me was the Market Overview section at the end. According to Gartner, the most prevalent future BI trends will be:

  1. 7% BI annual growth all the way until 2017
  2. Visual data discovery
  3. Easier data preparation
  4. Collaboration and social analysis
  5. Growth in Cloud BI
  6. Real-time BI
  7. Deemphasizing the BIG DATA hype

Join me at the Atlanta MS BI Group meeting tonight to discuss item 5 and at SQL Saturday in Atlanta on May 3rd to talk about item 6.

022414_1915_GartnersMag1

The Office Click-To-Run Setup

As you’ve probably head, Office 2013 supports now two installation options: the traditional MSI-based installation and the new Click-To-Run streaming installation. Chris Webb mentioned about it here and Melissa Coates describes how it works in more details here. The MSI setup is a perpetual one (you pay for a version once and you’re entitled to fixes for it) while the C2R setup is a subscription-based Office 365 setup (you continuously pay for using the software and you’re entitled to fixes and the latest features within the SKU you’re subscribed to). Perpetual installations will get updates (cumulative updates and service packs) just like they’re used to but they are meant primarily to be fixes rather than features. On the other hand, Office 365 subscribers have the benefit of getting fixes and new features as long as their subscription is active. Currently, there is no way to switch your existing Office installation from MSI to subscriber-based or vice versa. You must uninstall Office 2013 and reinstall. Once you do this, you’ll find that there is no difference as far as user experience. C2R still installs Office on the desktop although in different location.

The C2R setup has important ramifications on self-service BI. C2R users will have an always up-to-date service allowing Microsoft to add new functionality to the Office applications at a much faster rate. We’ve already seen this with the synonyms feature that are used for natural queries, aka Q&A (Q&A requires Power BI). Although I’ve initially dismissed the streaming installation, the C2R option now seems very attractive. I’ve already have an Office 365 subscription for e-mail and SharePoint. Shelving a few more bucks to upgrade to Power BI and stay on the latest and greatest seems like a good value proposition because I don’t have to wait for Office.NEXT to get the latest and greatest. More information about Office 365 plans can be found here. As an extension to Office 365, Power BI charges a premium as explained here.

A roadmap of C2R planned features is currently in the works so customers know the details of what’s coming up and when.

Best Visualization Tool for Dashboards?

More and more organizations are planning and adopting dashboards. And, the question “which visualization tool is the best for dashboarding?” has been asked more frequently. The visualization aspect of BI has been rapidly evolving. There are plenty of vendors and plethora of tools out there. And, they keep on leap-frogging each other and each one has its strong sides and limitations. More than likely, the darlings of today will be forgotten in a few years. So, a quest to find the perfect tool that does it all is likely to fail or it will be short-lived.

I’m not a visualization expert. When it comes to visualizations, I listen to guidance from experts. If you navigate to slide 30 of my “Best Practices for Implementing Enterprise BI Solution”, you’ll see a mockup of a sales dashboard by Stephen Few that is taken from his excellent “Information Dashboard Design” book. This is an example of a pixel-perfect layout with a lot of customizations, such as conditional formatting. No fancy gauges, no bouncing needles, the focus is on intuitive interpretation of data and not on the visualization fluff. If you decide to adopt such visualization standards, you probably already own a great tool for implementing dashboards – SQL Server Reporting Services – which supports bullet graphs, sparklines, as well as a high level of customization.

So, instead of investing in a myriad of tools and hoping that they will solve your BI challenges, my advice would be to spend your money on a solid architecture that would easily allow you to support multiple visualization tools and swap tools as new ones come on board. For example, if you like and decide to adopt Tableau for interactive data visualization and exploration, you’ll find that integrates nicely with SSAS. Here is a dashboard that was done without asking end users to take care of the data logistics and business calculations since this work has already been taken care of in the backend layer. You could also easily implement a similar interactive dashboard with Power View which might not have all visualizations that third-party tools now have but gains in other areas. Please don’t take this dashboard as a best practice, it was meant to only show the possibility of tool integration.

021614_1808_BestVisuali1

But you don’t have time and budget for beautiful architectures, right? Since you don’t get much help on the IT side of things (if you have IT at all), you want to delegate BI and let Business to take things in their own hands. However, no matter what visualization vendors would tell you, soon or later you’ll find that self-service BI still requires a proper foundation, as Key Unkroth explains nicely in his “Self-Service Business Intelligence Governance” presentation. At minimum, a department would need some sort of data repository that integrates and cleans the data before letting end users in. But if you’ve gone that far, before implementing dashboards, why not add a semantic layer that centralizes business logic and it’s supported by most popular visualization tools out there?