Posts

Help Improve Excel as Analysis Services Front End

Everyone has a different opinion about what self-service BI should be. But to many people the journey starts and stops with Microsoft Excel. Excel is the self-service BI nirvana. If the user can’t see and filter the detail data, even the most sophisticated self-service BI tool cannot be trusted. And since everyone knows how to do this in Excel, why should they use other tools? To me, the best self-service BI is empowering business users to connect to an organizational semantic model, ideally with Excel as a front end. Most of my current projects use Analysis Services Tabular for implementing semantic models. Therefore, it’s so frustrating that Excel still lacks good support for Tabular. For example, it splits a Tabular table into two tables (“dimension” and “measure group”) because Excel still uses the MDX interface. To make things worse, all fields in the “dimension” table has a Text data type because it gets only the field caption and not the data type. As a result, you can’t filter and compare date and number fields from the “dimension” tables.

According to Microsoft, a better Excel-Tabular combo hasn’t yet bubbled up high based on the feedback that the Excel team gets from customers. In an attempt to get the proper attention, I just posted the “Better Support for Analysis Services Tabular” wish list on Excel User Voice. I bundled multiple items into one wish list.

Please vote if you care.

It’s about time to improve support for SSAS Tabular:

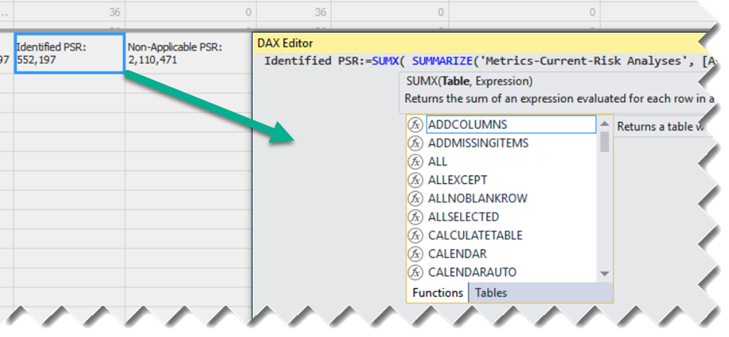
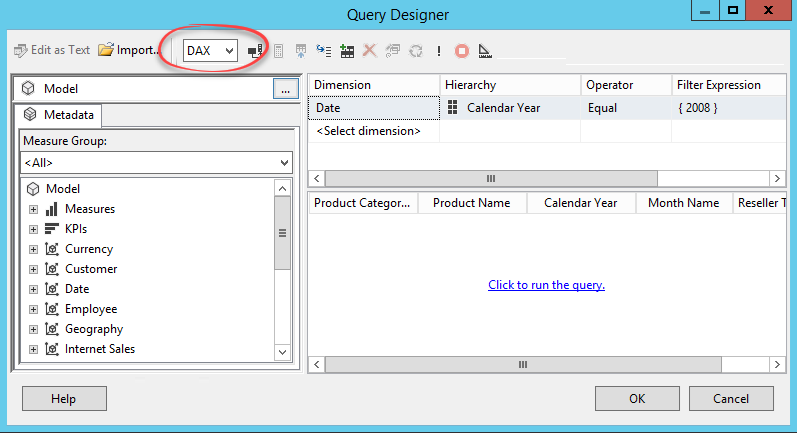
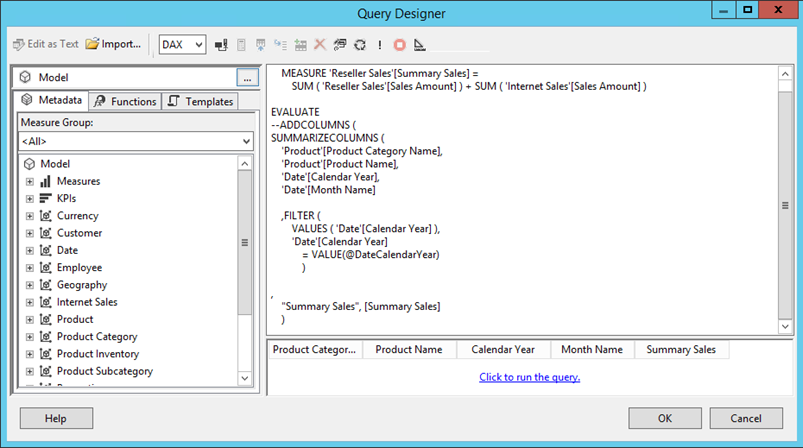
1. Auto-generate DAX.

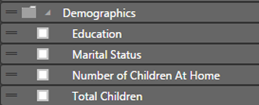
2. Avoid splitting a table into a “measure group” and “dimension”. See how PBI Desktop handles metadata.

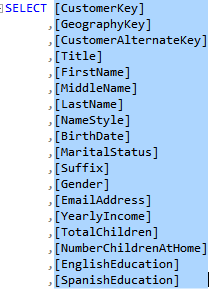
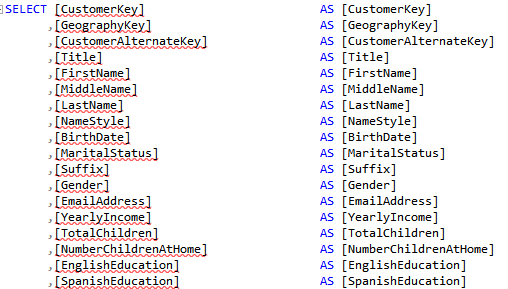
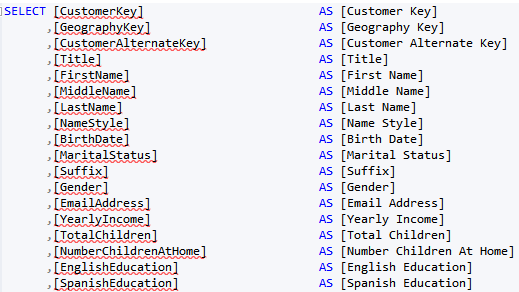
3. Carry over data types so that users can create reports, such as show me invoices where Due Date is greater than … Currently, all dimension table fields map to Text.

4. Many customers have expressed interest in connecting Excel tables directly to Tabular, bypassing Pivot Table, so they can use the column dropdowns and other Excel Table goodness.

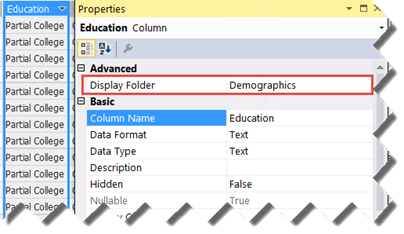
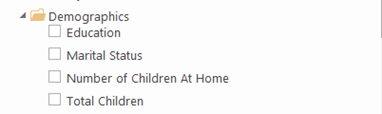
5. Support descriptions as tooltips when the user hovers on a field in the Field List.

SSRS Multivalue Parameters in DAX

UPDATE: Microsoft has added support for multi-valued parameters in the DAX Query Designer. Please read the discussion thread below for more info. You can use the approach discussed in this article if you need more control over the parameter handling, but the Microsoft-provided way should suffice for most cases and it’s easier to implement.

Déjà vu today with a twist. SSRS multivalue parameters in SSAS reports but this time in DAX. Now that SSAS Designer supports DAX queries, we should be able to do everything we were able to do in MDX, right? Unfortunately, as you will quickly discover, Microsoft “forgot” about multivalue parameters when working on the DAX Designer.

You can use MDX (no shame there) and write queries the old way, but if you are a DAX purist, you’d need to take the road less traveled which goes through the DAX rabbit hole.

Here are the high-level steps in the SSDT Report Designer/Report Builder and I tried my best to simplify this as much as I can:

  1. Do as much drag and drop using the DAX Graphical Query Designer to auto-generate the DAX query, as you won’t have another chance once you switch to a text mode. You can also use the graphical mode to declare your parameter(s) and to let SSRS autogenerate the report-level parameters and queries.
  2. If you let the DAX Query Designer auto-generate the parameter queries, change the Available Values of the report-level parameters to use ParameterCaption field (not the ParameterValue column). If the parameter uses default values, change the Default Values tab to set the default values by captions (not using pipe-delimited format that the DAX Designer auto-generates). Again, that’s because we’d use the parameter caption.
    011218_0216_SSRSMultiva1.png
  3. Go to the properties of the main dataset, flip to the Parameters tab and change the expression to concatenate the parameter values with a pipe “|”, such as =Join(Parameters!DateFiscalYear.Value,”|”). You’ll see why in a moment.
    011218_0216_SSRSMultiva2.png
  4. Now open the main DAX report query and switch to Text mode. Promise yourself never to go back to the Graphical mode (the one that lets you drag and drop). Click the Parameters button and reconfigure the parameter by selecting the empty value in the Dimension column. For testing the query inside the query designer, you might want to enter some pipe-delimited values in the Default column.
    011218_0216_SSRSMultiva3.png
  5. Change the main query to support multivalue parameters. The following query highlights the important changes:

    EVALUATE
    SUMMARIZECOLUMNS (
    ‘Date'[Fiscal Year],
    FILTER (
    VALUES ( ‘Date'[Fiscal Year] ),
    (
                OR (
                    ( @DateFiscalYear = “All” ),
                    PATHCONTAINS ( @DateFiscalYear, ‘Date'[Fiscal Year] )
                )
    )
    ),
    “Internet Total Sales”, [Internet Total Sales],
    “Reseller Total Sales”, [Reseller Total Sales]
    )

I removed the variable (VAR) definitions (not needed after simplifying the query). The filter expression uses an OR condition. If the user selects the parameter “All” value, then all rows are returned. If specific values are selected, the PATHCONTAINS function would return TRUE for that row in the filtered column (‘Date'[Fiscal Year] in this case) that matches one of the selected values. If you have more parameters, simply add more FILTER clauses.

I attach a report to demonstrate the changes.

Processing Tabular from Exotic Clients

Processing Tabular models from SSMS or .NET client apps is pretty straightforward. For example, you can connect with SSMS and issue processing commands through the UI or via TMSL. You can also use custom apps with Tabular Object Model (TOM) and you can send XMLA commands directly if you have an app perhaps that’s already doing that.

For Azure AS, it’s generally a good idea to run the app sending the processing command in the same data center where the Azure AS server is. If your Tabular database gets data from an Azure database, such as Azure SQL Database, the database should also be located in the same data center for better processing throughput and to avoid data transfer fees between data centers.

But what if you want to issue a processing command from more exotic clients, such as Python? Or, incrementally process from SSIS? Start with creating a JSON processing script (assuming Analysis Services 2016 or higher, or Azure AS). For the following script, processes two tables and the latest partition of the third table with the Data Only option (loads only the data). All objects are processed in parallel and 10 is specified as a maximum degree of parallelism. Then, it processes the database with Calculate option to restore calculated columns, relationships, and hierarchies.

Next, assuming you’re processing Azure AS, use one of the Microsoft-provided libraries to authenticate against Azure AD. For example, use the Python library to authenticate and submit the JSON in a standard XMLA message.

{
  "sequence": {
  "maxParallelism": 10,
    "operations": [
      {
        "refresh": {
          "type": "dataOnly",
          "objects": [
            {
              "database": "DatabaseName",
              "table": "Table1"
            },
            {
              "database": "DatabaseName",
              "table": "Table2"
            },
            {
              "database": "DatabaseName",
              "table": "Table3",
              "partition": "Table3 Partition 2017"
            }
          ]
        }
      },
      {
        "refresh": {
          "type": "calculate",
          "objects": [
            {
              "database": "DatabaseName"
            }
          ]
        }
      }
    ]
  }
}
processing

Considerations for Detail Reports

Nobody likes watching a report spinny. Interactive detail reports that perform well from an Analysis Services semantic layer have been the bane of my BI career. A “detail report” is a report that requests data at a lower level, e.g. policy in the insurance business, customer in Sales, etc. A detail report typically has many dimension attributes, eustomer Name, Account Number, Product Name, Product Number, etc. And, the more columns you add, the slower the report gets. The reason why such reports don’t typically perform so well when generated from a semantic layer is that Analysis Services is not SQL Server.

Multidimensional is an attribute-based model and the server cross joins the member values when you add attributes to the report. Don’t be misled by the “relational” nature of Tabular either. Its database engine (xVelocity) is an in-memory columnar database that still cross joins the column values. That said, Tabular should give you a performance boost for two reasons. First, its in-memory nature is generally faster than Multidimensional. Second, Excel has been optimized for Tabular, as I explain in my “Optimizing Distinct Count Excel Reports” blog, thanks to the undocumented PreferredQueryPatterns settings (although not listed in the msmdsrv.ini, it defaults to 1).

In a recent project, I migrated a customer from Multidimensional to Tabular. Besides other benefits, such of elimination of snapshots, reducing dramatically ETL time and analyzing data as of any date (not just at the month end), the customer wanted to improve performance of Excel detail reports. Previously, some of the detail reports would never return. After the migration, these reports would execute within a minute, and in seconds if the Excel subtotals are disabled.

Here are some tips you might find useful if you’re tasked to produce detail reports:

  1. If the detail reports don’t require too much interactivity, consider implementing them as SSRS paginated reports that connect directly to the database. The chances are that this approach will give you the fastest performance as the Database Engine is designed to retrieve data in sets by rows and the number of columns won’t probably affect report performance (unless of course many joins are required).
  2. If it’s desired to connect these reports to a semantic layer, consider Tabular because it’s better for wide & flat results.
  3. If Excel is used as a front end, consider Excel 2016 as Microsoft has made various performance improvements for detail reports.
  4. Consider disabling Excel subtotals, as explained here. In my scenario, a detail report with no subtotals would execute under 15 seconds. However, if I enable just one column subtotal, Excel switches to a completely different query pattern (with many nested DrilldownMember levels) and the report query would take a minute. That’s because now the query needs to obtain the subtotals for each group from SSAS. Since we’re at the mercy of the Excel MDX query generator, I hope the Excel team finds a way to produce more optimal MDX queries. Ideally, a future Excel release would allow binding Excel native tables directly to SSAS with ability to define subtotals and optimized queries to load the data.
  5. In my experience, Power BI reports that generate DAX don’t perform necessarily any better. To make things worse, while the new PBI Matrix visual can be configured to a flattened layout, it doesn’t currently support disabling specific subtotals (currently, you can remove all row subtotals or have them for each and every column). And asking for subtotals for every column might not only contradict business requirements but it could also severely affect performance. UPDATE 8/14/2017 – The August release of Power BI Desktop supports configuring row subtotals per level.

Many thanks to Akshai Mirchandani for the SSAS product group for not losing patience throughout all these years from my complaints on this subject.

081217_1845_Considerati1.jpg

Tabular DAX Editor

The Tabular toolset is getting better. One thing that I miss from Multidimensional is the cube script that lets you view all custom calculations in one place so that you can organize them any way you want, add comments, etc. This is why I contributed to the DAX Editor tool. Microsoft has taken notice and introduced a tool (also called DAX Editor) in the latest SSDT release. Read Kay Unkroth’s announcement here.

The Microsoft DAX Editor supports the old XML-based schema and the new JSON schema. On the upside, it gives you a break from the Measure Grid and the formula bar. On the downside, you can work only on one measure at the time. So, let’s leave it to marinate it a few more months with the hope that we can finally have a Tabular script. As Kay commented at the end of his blog post there is a hope:

Yes, we are hearing this a lot from you guys! Having all expressions in a single document makes it easy to find and replace, search, etc. It’s on the backlog, but not yet on the top of the priorities. Looking at the higher prio work we still need to get done , it’s more mid-termish. But we know how we want to achieve this and we are laying down the foundation with this DAX Editor. Btw. it is much, much more than just an editor window. That is really just the tip of the iceberg. Same with the DAX query window in SSSM. The real beauty (and complexity) is in the DAX parser behind these windows, and a few other features like IntelliSense. It’s coming together. Brick by brick!

Meanwhile, use the community DAX Editor.

SSRS Tabular Query Designer

Analysis Services Tabular has gained a lot of momentum for implementing organizational semantic models but its toolset has been lacking. SSRS developers had to rely previously on the MDX Query Designer to send MDX queries to Tabular. If DAX queries were preferred (and they often are for better performance since DAX is the native Tabular query language), developers had to type in DAX manually. And if the query would take parameters then the ugly workaround was to use … the DMX Query Designer.

As Chris Finlan announced yesterday, this will all change starting with the newly released Report BuilderSSDT 17 (currently in release candidate state), and SSMS 17 (also in RC state), as they now feature a Tabular Query Designer. SSMS also includes DAX Query Editor, as Christian Wade explains here.

If you’re familiar with the MDX Query Designer, you already know how to use the Tabular Query Designer. When you connect to Tabular, the query designer will discover it and default to DAX query mode. The dropdown allows you to switch to MDX should you prefer to send MDX queries to Tabular.

Similar to its MDX counterpart, in most cases you’d still need to know DAX to customize your queries. If you connect to Tabular version 2016 or above, you’d be able to drag and drop metadata to autogenerate the query. I think version 2016 or above is required because the designer relies heavily on the DAX SUMMARIZECOLUMNS function, which was introduced in 2016, when autogenerating queries.

The Design Mode lets you examine the underlying DAX query and customize it as needed. Sorry, no color coding or syntax checking in SSRS, so you’d probably rely on DAX Studio to code and test your queries or the new DAX Query Editor in SSMS which has syntax checking and IntelliSense.  The Calculated Member option is disabled and you’re on your own defining custom DAX measures. No big surprises here is it works exactly in same way as in MDX (of course you need DAX formulas, such as VALUE to convert to a numeric value).

It was about time for the Tabular Query Designer to appear to help us writing DAX when designing traditional SSRS reports connected to Tabular. Watch out for a bug where auto-generated parameter datasets error out when hierarchies are used. I attach two reports. Report.rdl demonstrated an auto-generated DAX query. ReportEx.rdl demonstrates a customized DAX query.

Vote to Give Tabular SE More Memory

I’m a big fan of Analysis Services and I’m doing a lot of work lately with Tabular. I rejoiced a lot after Microsoft included Tabular in SQL Server 2016 Standard Edition to increase its adoption but my enthusiasm was dampened by its maximum memory size of 16 GB. Interestingly, Multidimensional enjoys 64 GB of RAM in Standard Edition although you probably never need that much memory for OLAP cubes. As a memory-resident technology, Tabular is memory hungry. The current limitation of 16 GB is impractical. Twice the memory is required to process the database, leaving us with a database size of no more than 5 GB to be on the safe side. So, I started a quest to convince Microsoft to bring Tabular on a par with Multidimensional and increase its memory limit in Standard Edition to 64 GB. If you agree, please vote for my feedback on Connect.

Upgrading Power BI Desktop Models to Tabular

One great feature of Microsoft BI has been the continuum from personal BI to organizational BI. For example, a business user can start small with an Excel Power Pivot model which IT can restore at some point to a scalable Tabular model. In fact, if you know Microsoft personal BI (Power Pivot or Power BI Desktop), you already know 80% (or even more) of SSAS Tabular.

Unfortunately, currently there isn’t a supported way to restore Power BI Desktop models to Tabular or create a Tabular project from a pbix file. The reason is that because Power BI Desktop is changing on a monthly basis, it’s ahead of Tabular and currently Power BI Desktop doesn’t support backward compatibility. However, the following approach worked for me to upgrade Power BI Desktop to Tabular 2016.

  1. Power BI Desktop has a Tabular child process which is the workhorse for all data crunching you do on the desktop. This process uses a dynamic port. As a first step, you need to find that port. The easiest way to do so is to run Windows Resource Monitor (in the Windows search bar, type resmon). Then, flip to the Network tab, and in the Listing Ports section, find “msmdsrv.exe”, and then note the port number. In my case, I have a few instances of msmdsrv because I run dedicated instances of Multidimensional and Tabular but I found that the PBI Tabular instance ports start above 10000 so it should be easy to identify the instance.

    071016_1926_UpgradingPo1.png

  2. Now that you have the port number, open SSMS 2016 (you can download it from here), and connect to that Tabular instance, using the syntax: localhost:<port number>. For example, to connect to the highlighted instance, in SSMS I’ll Connect ð Analysis Services, and then enter localhost:42030.

TIP: You can also use the SQL Profiler to connect to the PBI Tabular instance and do profiling using SQL Profiler, as Adam Saxton demonstrates here, or using DAX Studio, which by the way automatically enumerates the Power BI Desktop instances.

  1. Right-click the database (the database name is a guid), and click Script ð Script Database As ð CREATE TO ð Clipboard. This will export the database schema in the new JSON format.
  2. Connect to the Tabular instance that will host the database, and create a new Analysis Services XMLA Query, and paste the script. One of the changes you want to make here is to rename the database by change the name element at the beginning of the file so you don’t end up with the same guid for the database name.
  3. Execute the script to create the new database. If you get an error, you should be able to change the script and strip code for features that Tabular doesn’t support. Now that we have JSON-based schema, making such changes should be much easier.

Now you can use SSDT to create a project by importing the Tabular database and continue making changes to the project.

Tabular Display Folders

A welcome usability enhancement in SQL Server 2016 Tabular is the ability to configure display folders to organize table fields and measures in logical folders. Previously, you had to use BIDS Helper or DAX Editor (for measures) to implement display folders. Starting with SQL Server 2016, you can just set the Display Folder property of a measure or a field.

This adds the display folder to Fields List in Excel and Power BI Desktop.

Implementing User Friendly Names in Tabular

Scenario: You’d want to have user-friendly field names in Tabular, Power Pivot, and Power BI Desktop, such as Claim Amount as opposed to database column names, such as ClaimAmount or Claim_Amount. Multidimensional has a feature that automatically delimits words with spaces when it detects a title case or underscore but Tabular lacks this feature. While you can rename fields in Tabular on field at the time, each step requires a commit action, thus taking long time to rename all fields.

Solution: While I’m not aware of a tool for renaming fields, the following approach should minimize the tedious work on your part:

  1. Wrap your table with a SQL view. It’s a good practice anyway.
  2. Alias the table columns. If you have a lot of columns, the easiest way to alias your columns is to use vertical copy and paste.
    1. In SSMS, script the table as SELECT TO. This generates the SELECT statement in a suitable format for the next steps (column names enclosed in square brackets, comma on the left).
    2. Hold the Alt key and select all columns by doing a vertical selection to enclose all column names, excluding the commas.
    3. Press Ctrl-C to copy.
    4. Hold the Alt key again. Click a place to the right of the first column and drag the mouse cursor down until you reach the last row where the last column is. You should see a vertical line going down.
    5. Type ” AS ” without the quotes. The net effect is that SSMS enters AS for each column.
    6. Press Ctrl-V to paste the column names. Here is the net result:
  3. Now you can delimit the words with spaces. But if you have many columns, this can quickly get tedious too. Enter regular expressions.
  4. Hold the Alt key again for vertical selection and select all alias columns, excluding “AS”.
  5. Press Ctlr-H to bring up the SSMS Find & Replace. In the Find field, enter the regular expression ~(\[)[A-Z]. This expression searches for any capital letter after the left square bracket [.
  6. In the Replace field, enter ” \0″ without the quotes. Notice that these is a space before the backslash. This replaces the capital letter match with an empty space and the capital letter.
  7. Check the “Match Case” and “Use Regular Expressions”. Make sure that the “Look In” drop-down is set to Selection to avoid apply the replace to all the text.
  8. Click Replace All. Now you have all words delimited.

The regular expression I use is not perfect. It won’t discriminate capital letters; for example, it will delimit consecutive capital letters, such as ID as I D, but it’s faster to fix the exceptions than doing all replacements manually. And if you end up with a better expression, please send it my way. The last step, of course, is to import the view and not the table in Tabular, Power Pivot, or PBI Desktop.