Implementing User Friendly Names in Tabular
Scenario: You’d want to have user-friendly field names in Tabular, Power Pivot, and Power BI Desktop, such as Claim Amount as opposed to database column names, such as ClaimAmount or Claim_Amount. Multidimensional has a feature that automatically delimits words with spaces when it detects a title case or underscore but Tabular lacks this feature. While you can rename fields in Tabular on field at the time, each step requires a commit action, thus taking long time to rename all fields.
Solution: While I’m not aware of a tool for renaming fields, the following approach should minimize the tedious work on your part:
- Wrap your table with a SQL view. It’s a good practice anyway.
-
Alias the table columns. If you have a lot of columns, the easiest way to alias your columns is to use vertical copy and paste.
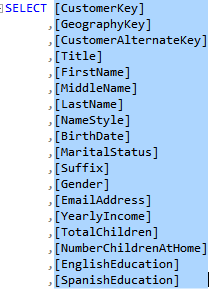
- In SSMS, script the table as SELECT TO. This generates the SELECT statement in a suitable format for the next steps (column names enclosed in square brackets, comma on the left).
- Hold the Alt key and select all columns by doing a vertical selection to enclose all column names, excluding the commas.

- Press Ctrl-C to copy.
- Hold the Alt key again. Click a place to the right of the first column and drag the mouse cursor down until you reach the last row where the last column is. You should see a vertical line going down.
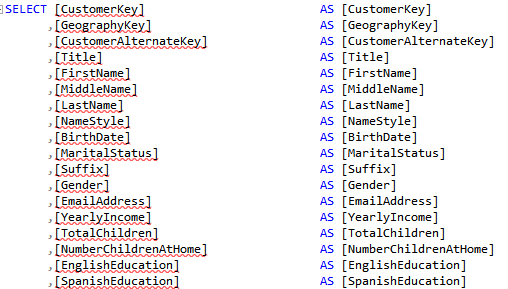
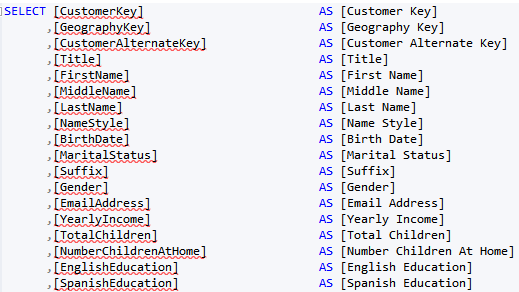
- Type ” AS ” without the quotes. The net effect is that SSMS enters AS for each column.
- Press Ctrl-V to paste the column names. Here is the net result:
- Now you can delimit the words with spaces. But if you have many columns, this can quickly get tedious too. Enter regular expressions.
- Hold the Alt key again for vertical selection and select all alias columns, excluding “AS”.
- Press Ctlr-H to bring up the SSMS Find & Replace. In the Find field, enter the regular expression ~(\[)[A-Z]. This expression searches for any capital letter after the left square bracket [.
- In the Replace field, enter ” \0″ without the quotes. Notice that these is a space before the backslash. This replaces the capital letter match with an empty space and the capital letter.
- Check the “Match Case” and “Use Regular Expressions”. Make sure that the “Look In” drop-down is set to Selection to avoid apply the replace to all the text.
- Click Replace All. Now you have all words delimited.
The regular expression I use is not perfect. It won’t discriminate capital letters; for example, it will delimit consecutive capital letters, such as ID as I D, but it’s faster to fix the exceptions than doing all replacements manually. And if you end up with a better expression, please send it my way. The last step, of course, is to import the view and not the table in Tabular, Power Pivot, or PBI Desktop.