SQL Server Magazine published the second part of my Protect UDM with Dimension Data Security article in the October issue of the magazine. In this article, I explain how to use MDX expressions to implement dynamic dimension security. I discuss two practical approaches for meeting advanced requirements for securing UDM data. First, I present a solution in which the security policies are stored in a factless fact table. Next, I explain how to leverage SSAS stored procedures to integrate UDM with an external security service.
The article is available for public access. Enjoy!
https://prologika.com/wp-content/uploads/2016/01/logo.png00Prologika - Teo Lachevhttps://prologika.com/wp-content/uploads/2016/01/logo.pngPrologika - Teo Lachev2007-09-21 20:39:262021-02-16 03:01:16Protect UDM with Dimension Data Security Reloaded
If your organization can afford SAN, here is another best practices article by Carl Rabeler from the SSAS team. The Scale-Out Querying with Analysis Services Using SAN Snapshots article “describes the use of virtual copy SAN snapshots in a load-balanced scalable querying environment for Microsoft SQL Server 2005 Analysis Services to increase the number of concurrent queries to Analysis Services servers with a rapid response time per query.”
https://prologika.com/wp-content/uploads/2016/01/logo.png00Prologika - Teo Lachevhttps://prologika.com/wp-content/uploads/2016/01/logo.pngPrologika - Teo Lachev2007-09-12 20:11:532021-02-16 03:01:13Scale-Out Querying with Analysis Services Using SAN Snapshots
Those of you preparing for Microsoft exam 70-445 Microsoft SQL Server 2005 Business Intelligence – Implementation and Maintenance may be interested to know that Microsoft Press has just published a training kit with the same title which I co-authored with Erik Veerman, Dejan Sarka, and Javier Loria from Solid Quality Learning. I wrote four of the SSAS chapters. I also took the actual exam prior to writing the content so I hope the book will help you to prepare and pass 70-445.
https://prologika.com/wp-content/uploads/2016/01/logo.png00Prologika - Teo Lachevhttps://prologika.com/wp-content/uploads/2016/01/logo.pngPrologika - Teo Lachev2007-09-12 12:04:412021-02-16 03:01:12MCTS Self-Paced Training Kit (Exam 70-445): Microsoft SQL Server 2005 Business Intelligence—Implementation and Maintenance
As I mentioned in my Under the Hood post, the SSRS 2008 engine has been redesigned to perform on-demand report processing for better scalability. As a result, textbox values are calculated on-demand every time the containing page is rendered. Irrespective of the on-demand behavior, values of dataset-bound textboxes won’t change because the underlying dataset is cached in the report database. Therefore, the end result for dataset-bound textboxes is the same as with SSRS 2005.
What about expression-based values? For example, you may have a textbox that references some custom method. Unlike SSRS 2005, the new engine will execute that method each time the page is rendered. This may be or may not be what you want. If you need up-to-date information, the new behavior will be welcome. However, there will be cases, when you may need the old behavior where the custom code is executed once. For example, imagine that the custom code takes very long time to execute and you want to cache the result. Or, you don’t want the report results to change when you navigate pages, such as when you need to deal with currency conversion rates. Enter variables – a new feature in SSRS 2008.
In SSRS 2008, variables provide a mechanism to guarantee an at most once evaluation semantics. Just like programming variables, SSRS variables store values. Variables can be scoped at report or group levels (note that the CTP 4 build of the Report Designer Preview exposes only report variables). A report-level variable is evaluated once for the lifetime of the report. A group-level variable is evaluated each time the group changes.
Report variables
They are accessible from within the report body and page sections.
<Report …>
…
<Variables>
<Variable Name=”VExchangeRate”>
<Value>
=MyCustomAssembly.GetExchangeRate()
</Value>
</Variable>
</Variables>
Group variables
Their value is only defined within the current group instance and the inner group hierarchy.
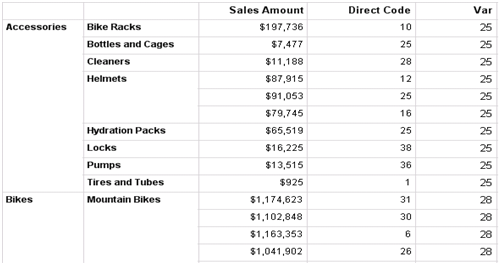
Here is a report that demonstrates a group variable.
The Direct Code column has an expression-based textbox that references the custom method directly =Code.Util.GetValue(). The GetValue method simply generates a random value. When I navigate from and back to a page, the Direct Code column values change as a result of the on-demand behavior. In contrast, the Var column uses the following expression: =Variables!Var2.Value. The Var2 variable is declared as a group-level variable inside the tablix group:
Now, the result is completely different. Because a variable stores the result, the column values don’t change within the same group. More importantly, the values are constant between page refreshes. At this point, you are probably thinking about other useful scenarios for variables. However, you cannot use variables to maintain state. They are evaluated at most once and are read-only.
One of the major themes in SSRS 2008 is scalability. A significant effort will be made to ensure that SSRS scales well with large reports. Why is this needed? Recall that in SSRS 2005 (and 2000), report processing is instance-based. This means that the report engine would process the entire report as a snapshot, including textbox values, styles, etc. As a result, SSRS 2005 reports are memory-bound. In general, the memory consumed by SSRS 2005 is proportional to the size of the report. The bigger the report, the more memory it would take. Therefore, large reports won’t scale well.
In contrast, the SSRS 2008 processing engine processes the reports on-demand. It pre-computes and saves only certain invariants, such as grouping, sorting, filtering, and aggregates. However, textbox values are calculated on-demand every time the containing page is rendered. To test this, drop a textbox on the report and set its value to =Now(). In SSRS 2005, when you page back and forth, the textbox value will not change. In contrast, in SSRS 2008, the textbox value would change to the most current date each time the containing page is rendered.
As a result of the on-demand processing model, the in-memory presentation of the report is much smaller. If you want to learn more about the engine improvements in Katmai, I highly recommend the Chris Baldwin’s excellent Enterprise Scale Report Engine webcast. At this point, you may wonder how much memory the new engine could save. I tested print preview for an existing 1,270 report with the old and new engine and here are the results.
SQL Server 2005
Time (s)
Memory SQL (MB)
Memory RS (MB)
TFP (time to first page)
262
130
240
TLP (time to last page)
610
207
312
SQL Server 2008
TFP
218
56
95
TLP
430
44
95
Improvement (TLP)
30%
79%
70%
As you can see, in this case the new engine takes 70% less memory which is a pretty remarkable improvement. This is not to encourage you to author such monster reports of course. However, if you have to, for audit, regulatory, or whatever reasons, the new engine should be able to help.
Performance is the most common incentive for using Analysis Services. Yet, despite the advances in the SSAS management tools, optimizing the MDX query performance is still considered as “black magic” by many. Graphical optimization tools similar to the SQL query optimizer and query showplan would definitely help but they are not expected anytime soon. Meanwhile, Microsoft has just published a 60-page whitepaper Identifying and Resolving MDX Query Performance Bottlenecks in SQL Server 2005 Analysis Services by Carl Rabeler and Eric Jacobsen. At first sight this resource looks like a must-read for anyone looking for tips to make that query execute a few seconds faster. From the article summary:
“To improve the performance of an individual MDX query that is performing poorly, you must first identify the source(s) of the performance bottlenecks in the execution of the query. This requires that you understand how to use Windows and SQL Server 2005 Analysis Services troubleshooting tools. This best practices article provides information about available troubleshooting tools and demonstrates how to use the most common of these tools to identify and resolve MDX query performance bottlenecks.”
Microsoft launches a preview of a cool search portal dubbed Tafiti to bring the web search to a new level and give Google a run for its money. From FAQ “Tafiti, which means ‘do research’ in Swahili, is an experimental search front-end from Microsoft, designed to help people use the Web for research projects that span multiple search queries and sessions by helping visualize, store, and share research results. Tafiti uses both Microsoft Silverlight and Live Search to explore the intersection of richer experiences on the Web and the increasing specialization of search.”
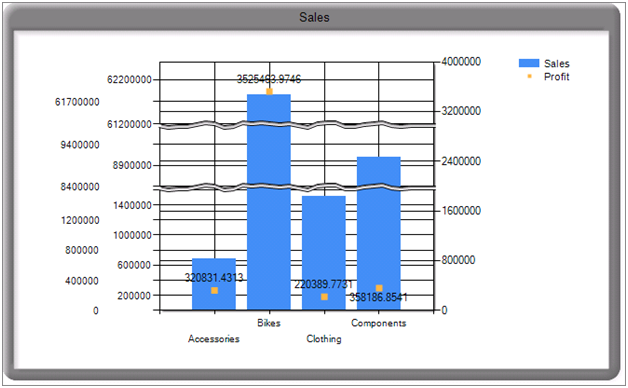
It is old news by now that Microsoft has acquired the intellectual rights to the Dundas Reporting Services controls, including the Dundas chart, map, gauge, and calendar. At this point, it is not known if all controls will make it to Katmai but the chart will definitely will. The July CTP (CTP4) includes a preliminary version of the Dundas chart that has been converted from a custom report item to a native region. Many of the properties are not hooked yet but you can witness some of the new enhancements. Although somewhat unpolished, the following report demonstrates some of these features.
The report features two charts in one – a column sales chart and a scattered profit chart. They are projected on two value axes. Having a secondary axis wasn’t supported by SSRS 2005. Also, the first value axis has axis breaks. Since the Bikes sales exceed by far the sales of the other categories, an axis break on Sales is used to prevent the Bikes sales to eclipse the other categories. This wasn’t possible before. Now, it is matter of enabling a checkbox. The chart region will compute the axis break automatically for you.
Of course, this just scratches the surface. The Dundas chart control is one of most complex and powerful controls on the market. The bottom line is that SSRS 2008 will definitively pretty up your reports and dashboards.
As I mentioned in a previous blog, SQL Server 2008 will probably include an RDL Object Model. This is great news for developers who generate report definitions programmatically. No more custom RDL object models as the one I talked about during my TechEd presentation. The early incarnation of the promised object model is included in the July CTP (CTP4) and resides in the \Microsoft SQL Server\MSSQL.3\Reporting Services\ReportServer\bin\Microsoft.ReportingServices.RdlObjectModel.dll assembly.
DISCLAIMERBefore rejoicing too much, recall the usual disclaimer that everything is in a flux and a subject to change. Although here, the RDL Object Model may very well disappear in the final bits.
Note that I disclaimed myself let me introduce you to the RDL Object Model (don’t try to find it in BOL; long live .NET Reflector!).
using System;
using System.IO;
using Microsoft.ReportingServices.RdlObjectModel;
using Microsoft.ReportingServices.RdlObjectModel.Serialization;
namespace RDL
{
class Program
{
staticvoid Main(string[] args)
{
string idef = @”C:\Reports\Sales by Product.rdl”; // input report in RDL 2008 format
string odef = @”C:\Reports\Sales by Product1.rdl”; // output report in RDL 2008 format
Report report = null;
RdlSerializer serializer;
if (!File.Exists(idef)) return;
// deserialize from disk
using (FileStream fs = File.OpenRead(idef))
{
serializer = new RdlSerializer();
report = serializer.Deserialize(fs);
}
report.Author = “Teo Lachev”;
report.Description = “RDL Object Demo”;
// TODO: use and abuse RDL as you wish
// serialize to disk
using (FileStream os = newFileStream(odef, FileMode.Create))
{
serializer.Serialize(os, report);
}
}
}
}
As you can see, using the RDL Object Model is simple. Once you add the reference to (\Microsoft SQL Server\MSRS10.MSSQLSERVER\Reporting Services\ReportServer\bin\Microsoft.ReportingServices.RdlObjectModel.dll, you are work with RDL in object-oriented way. You use the RDLSerializer class to load a report definition (Deserialize method) or get RDL from a report object (Serialize method). Both methods support various overloads to read/write from/to stream, XmlReader, and more. I load an existing Sales by Product report into the Report object using the RDLSerializer.Deserialize() method. Note that it must be saved in the SSRS 2008 format. You need to use the stand-alone Report Designer to do so. If you use the SSRS 2005 format you will get an exception because you will need to upgrade to RDL 2008 (see next paragraph about how to upgrade RDL). From there, I write the report object back to disk as a Sales by Product1.rdl file. What could be easier? Compare this with XmlDom programming and you will start seeing how the RDL Object Model can make your life easier.
There are also methods for upgrading RDL to SSRS 2008 (Microsoft.ReportingServices.ReportProcessing.RDLUpgrader .UpgradeToCurrent) and SSRS 2005 (Microsoft.ReportingServices.ReportProcessing.RDLUpgrader .UpgradeTo2005) formats.
An RDL object model has been long due on my wish list. Kudos to the SSRS team for materializing it.
https://prologika.com/wp-content/uploads/2016/01/logo.png00Prologika - Teo Lachevhttps://prologika.com/wp-content/uploads/2016/01/logo.pngPrologika - Teo Lachev2007-08-14 22:10:002021-02-16 03:01:07RDL Object Model on the Horizon
Many report developers find the SSAS data provider too restrictive for authoring reports from UDM. Instead, they replace it with the native Microsoft OLE DB Provider for Analysis Services 9.0 which gives them maximum flexibility at the expense of convenience (the query has to be hand-generated, parameters are not supported, extended properties are not available, etc).
By default, the OLE DB provider doesn’t return the extended cell properties, such as format and color settings. Thanks to Robert Bruckner from the SSRS team, here is a precious tip to get the extended properties:
Append Extended Properties=”ReturnCellProperties=true” to the OLE DB connection string of your data source, e.g.:
Provider=MSOLAP.3;Data Source=localhost;Initial Catalog=”Adventure Works DW”;Extended Properties=”ReturnCellProperties=true”
Request the cell properties in your MDX query as the SSAS provider does, e.g.:
SELECT NON EMPTY { [Measures].[Internet Sales Amount], … } ON COLUMNS,
NON EMPTY { [Sales Territory].[Sales Territory Group].[Sales Territory Group].ALLMEMBERS , …. }
FROM [Adventure Works] CELL PROPERTIES VALUE, BACK_COLOR, FORE_COLOR, FORMATTED_VALUE, FORMAT_STRING, FONT_NAME, FONT_SIZE, FONT_FLAGS
Execute the query. The OLE DB Provider returns the extended properties as fields in the dataset.
You will notice that the OLE DB provider returns the cell colors as numeric values. To convert the SSAS numeric colors to RGB colors for use on your report, you can use this helper function in your report.
int intValue = ConvertToInt32(value, out isValid);
if (isValid) {
return String.Format(“#{0:x2}{1:x2}{2:x2}”,
(intValue & 0x000000ff),
(intValue >> 8) & 0x000000ff,
(intValue >> 16) & 0x000000ff);
}
https://prologika.com/wp-content/uploads/2016/01/logo.png00Prologika - Teo Lachevhttps://prologika.com/wp-content/uploads/2016/01/logo.pngPrologika - Teo Lachev2007-08-14 19:01:262016-02-17 12:24:32How to Get Extended Properties with SSAS OLE DB Provider