Microsoft declared build #1442.32 to be the official SQL 2008 RC0 build and made it publicly available.
Key SSRS improvements in this build:
Rich text formatting. You can now format the text inside a textbox with different styles.
Report Wizard to let the user auto-generate the report definition.
Fully functional MDX Query Designer.
An updated build of the Report Builder 2.0 (aka Report Designer Preview) will be available via a web download. The URL link is not known at this point.
Chris Webb, a fellow MVP and MDX guru, who’s blog is a must-read for all SSAS junkies, was kind enough to let me take a look at the Intelligencia Query product he’s been working on for a while with Andrew Wiles. Chris announced the product back in April which is now selling as a commercial offering.
Now, lots of things have been said about the current state of the SSRS-SSAS integration, which is to say the least wanting. In a previous blog, I wrote “In my opinion, the biggest challenge the Microsoft BI initiative faces today is the inadequate support for Analysis Services.” Alas, we won’t witness an improved SSRS-SSAS integration in SQL Server 2008 as Microsoft decided to focus on other areas and priorities.
Rest assured though that Microsoft understands the importance of this integration scenario. I personally have voiced my concerns on a few occasions and have put this on the top of my wish list which I shared with the Reporting Services team. There are good things happening already which make me believe that SQL Server.NEXT (post-SQL Server 2008) will materialize this wish. What’s really needed is Excel-like support of SSAS in Reporting Services, plus calculated members which are already supported.
Then, the question is what to do meanwhile if you target Analysis Services (and you should). One approach is to take the “I’ll stick with Microsoft” approach. This may require you find workarounds for the static schema and other limitations, such as using the Microsoft OLE DB Provider for Analysis Services instead of the built-in SSAS provider. This is not as bad as it seems as little out-of-box thinking usually gets the job done. By the way, I wrote some 50 pages in my next book to cover integrating SSRS with SSAS in as much detail as possible.
The second approach is to look at third-party offerings, such as Radius Producer and Intelligenca Query. What I liked about Intelligenca Query is that it doesn’t require throwing the baby with the water. You can still keep the Microsoft Report Designer but use Intelligenca Query to replace the built-in SSAS provider. This works because just like the built-in provider, Intelligenca Query is implemented as a data extension. I tested Intelligenca Query with SQL Server 2008 and it worked without any issues with the BIDS Report Designer and Report Builder 2.0 (aka Report Designer Preview).
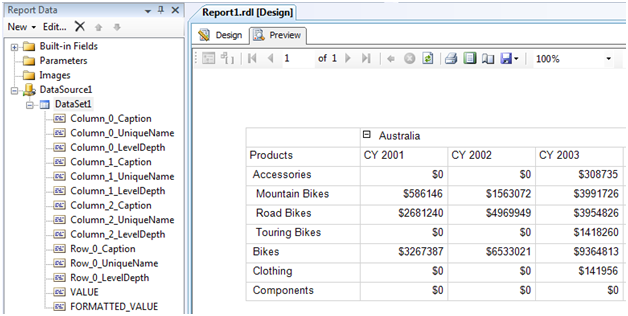
The good thing about Intelligenca Query is that it lets you plug in an arbitrary MDX query. Behind the scenes, it pulls out a little trick where it rewrites the report dataset by transposing columns to rows. Consequently, you have to use the matrix region to rotate the rows back to columns to recreate the original query results. Now, my ideal provider would support a dual mode where I can tell it not to rewrite anything but just to give me the results. Of course, if another dimension member is added, it won’t show up on the report columns (assuming a table with fixed columns) but I can see this being useful for notice users that create ad hoc reports or when the columns are fairly static.
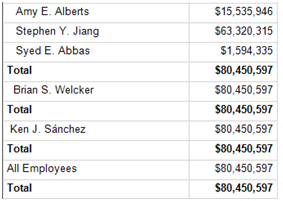
Another thing I liked, of course, about Intelligenca Query is that it eliminates the nagging issue of server aggregates which are the aggregates for the dimension All members. With the built-in provider, you have to explicitly request them by using the Aggregate function but they won’t be retuned if you hand-code your query. Intelligenca Query simply brings them as additional rows. What if you don’t want them, such as when you need a group footer? No problem, just exclude them from the query and group on the rest of the rows.
Another cool thing is working with parent-child hierarchies. The MS built-in provider takes this strange design pattern where it dumps all members in a single column, thereby making it virtually impossible to create subtotals per level. With Intelligence Query this issue disappears:
I also liked the graphical query designer which is pretty much in par with the Microsoft graphical MDX Query Designer. On the downside, some outstanding work is required to handle parameters and synchronize the text query with the graphical designer.
If the SSAS built-in provider is driving you nuts, I encourage you to take a look and evaluate Intelligenca Query.
You won’t enable SSAS HTTP connectivity via a SharePoint site.
Issue
You followed the instructions in the Configuring HTTP Access to SQL Server 2005 Analysis Services on Microsoft Windows Server 2003 whitepaper but you get ” Failed to start monitoring directory changes” error when you try to access the SSAS server by its pump URL, such as http://www.adventure-works/olap/msmdpump.dll.
Solution
Ignore the step where you had to create an olap pool and assign the OLAP vroot to it. Instead, assign the vroot to the same IIS application pool as the one the SharePoint site belongs to, such as SharePoint -80. In addition, make sure you enable the web extension to the pump dll, as explained in the above article.
If you have created non-domain Windows accounts on the server for testing, make sure that the server and local Windows accounts (the one the user will use to log in to the user machine) are synchronized, that is, have the same name and password. For example, if I create a non-domain local account Bob on the server where SSAS is installed, Bob must log in to his machine as Bob and both accounts (user and server) must have the same password.
You need to configure a SharePoint site integrated with Reporting Services for Internet access. In our case, the end users would authenticate with Windows security by using local Windows account created on the web server.
Issues
Report URLs reference the machine NetBIOS name and fail to execute with “The path of the item ‘<path’ is not valid. The full path must be less than 260 characters long; other restrictions apply”. Same happens when Report Builder tries to load models.
Solution
This one took a few hours to solve:
Since Reporting Services 2008 only supports access from SharePoint URLs in the default zone, change the public URL of the default zone (SharePoint 3.0 Central Administration -> Operations -> Alternate Access Mappings) to the web server Internet URL, such as http://www.adventure-works.com/.
This will take care of the report URLs which now should include the server Internet address. However, requesting reports would result in rsItemNotFound errors although the report URLs look perfectly normal.
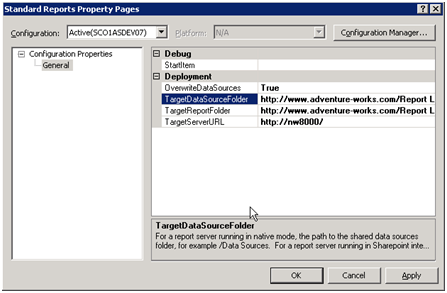
Open the report project in BIDS. In the project properties, change the TargetDataSources and TargetReportFolder settings to include the server Internet URL instead of NetBIOS names, such as http://www.adventure-works.com/Report Library/Shared Documents/Data Sources for the TargetDataSource setting.
Redeploy the report definition.
At this point, standards reports deployed to SharePoint should work. If you use local server accounts for your users, however, previewing reports in Report Builder may fail with mysterious errors about invalid semantic queries. You can solve this issue by making sure that the user logon and server accounts are identical, that is, have the same name and password.
https://prologika.com/wp-content/uploads/2016/01/logo.png00Prologika - Teo Lachevhttps://prologika.com/wp-content/uploads/2016/01/logo.pngPrologika - Teo Lachev2008-05-10 00:55:522016-02-17 11:27:32Sharing Lost Reports with Web Users
Q: How to make the darn parameter drop-down list wider in HTMLViewer? HTMLViewer is the Report Manager control that displays the report when you view the report.
A: HTMLViewer supports limited customization via a CSS stylesheet.
Copy HTMLViewer.css to MyHTMLViewer.css in the same folder (Reporting Services\ReportServer\Styles). Note that the actual folder path varies between SQL Server versions.
Add the following CSS style to MyHTMLViewer.css
SELECT {
font-size: 8pt;
font-family: Verdana;
width:200px
}
As a result, all SELECT elements on the page (all dropdowns, such as parameter prompts, zoom, export) will pick up these settings.
Configure the server to use the custom stylesheet by one of these options:
If you want to apply the custom styles to all reports, add a new HTMLViewerStyleSheet element to the rsreportserver.config file, such as:
Note that due to an unfortunate bug, the HTMLViewerStyleSheet setting doesn’t work with February CTP of SQL Server 2008 but it will be fixed in the final release.
Use the rs:Stylesheet device setting to apply the custom style to given report only, such as:
http://localhost/ReportServer?/AdventureWorks Sample Reports/Product Line Sales&rs:Command=Render&rc:Stylesheet=MyStylesheet
I happy to announce my book “Applied Microsoft Analysis Services 2005” is now available as an Adobe PDF e-book. The first retailer that Google Alerts reported to sell it is Diesel Ebooks. It should soon pop up on all popular ebook retailer sites, such as ebooks.com. The suggested retail price for the ebook version is set to $39.95, which is ten bucks cheaper than the suggested retail price of the paper copy. The ebook is DRM-protected but fully functional with unlimited printing and copying capabilities. The DRM protection is handled by the retailer. Since the distributor is not set up to handle different pricing models, such as buy the paper copy and get the ebook free, there is no discount pricing model for the e-book version at this time.
Also, the same book is now available on Amazon Kindle. Since I don’t have an Amazon Kindle, I don’t know what the Kindle version looks like. Unfortunately, Amazon doesn’t support PDF. They use proprietary software that converts the book to the Kindle native format (AZW). If you buy the Kindle copy, please drop me a note to share your feedback.
I have to admit that my preoccupation with Reporting Services and Analysis Services don’t leave me much bandwidth nowadays to tackle other Microsoft BI (far less third-party) offerings. One of the products I know I need to catch up is the planning component of PerformanceServer, formerly known as Biz#. Fortunately, Nick and Adrian followed up on their The Rational Guide To Planning with Microsoft Office PerformancePoint Server 2007, which I wrote about, with a new book The Rational Guide To Planning with Microsoft Office PerformancePoint Server 2007. Initially, they were planning a single PerformancePoint book but they decided to split it because of book size limitations that the publisher has.
The planning piece of PerformancePoint requires more than solid knowledge of Analysis Services because of its strong financial focus. You need to know quite a bit about budgeting, planning, chart of accounts, and other financial concepts. Fortunately, The Rational Guide To Planning with Microsoft Office PerformancePoint Server 2007 fills in the gap and bridges the implementation and business audiences by providing an essential coverage of the product accompanied with practical examples, all in a portable light-size format.
https://prologika.com/wp-content/uploads/2016/01/logo.png00Prologika - Teo Lachevhttps://prologika.com/wp-content/uploads/2016/01/logo.pngPrologika - Teo Lachev2008-03-15 22:46:212016-02-17 11:33:37The Rational Guide To Planning with Microsoft Office PerformancePoint Server 2007
February CTP is out. It brings the much anticipated integration with Visual Studio 2008 and the new BIDS Report Designer.
Download the February CTP here: http://www.microsoft.com/sql/2008/prodinfo/download.mspx
Updated Books Online for February CTP are available here: http://www.microsoft.com/downloads/details.aspx?familyid=19DB0B42-A5B2-456F-9C5C-F295CDD58D7A&displaylang=en
What’s new in Reporting Services February CTP (compared to the previous November 2007 CTP):
Support for Microsoft Word Rendering
This allows users to render reports as Word documents that are compatible with Microsoft Word 2000 and greater.
Data Visualization Enhancements
Data Visualization Enhancements provides significantly improved support for Chart and adds support for Gauge controls directly within reports.
SQL Server 2008 Reporting Services Add-in for Microsoft SharePoint Technologies
The SQL Server 2008 Reporting Services Add-in for SharePoint Technologies allows you to take advantage of SQL Server 2008 report rendering, processing and management capabilities in SharePoint Integrated mode. This version includes Data-driven subscriptions.
Report Design Enhancements in Business Intelligence Development Studio (BIDS)
BIDS overall has been migrated from a Visual Studio 2005 to Visual Studio 2008 platform. In addition, the report design tools found in BIDS were significantly updated for Reporting Services. Updates include:
– the more powerful Tablix based Tables, Lists, Matrices
– the Report Data window for easier interaction with data fields
– the integration of data visualization enhancements (Chart, Gauge)
– new dialogs throughout the design experience
Throughput Enhancements
Further improvements in report rendering throughput, the number of reports rendered in a given amount of time for several types of workloads.
https://prologika.com/wp-content/uploads/2016/01/logo.png00Prologika - Teo Lachevhttps://prologika.com/wp-content/uploads/2016/01/logo.pngPrologika - Teo Lachev2008-02-22 12:41:512016-02-17 11:35:02SQL Server 2008 February CTP Is Out
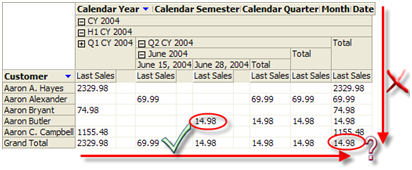
Enterprise Edition of Analysis Services 2005 and 2008 supports semi-additive functions, such as LastNonEmpty, LastChild, and so on, to facilitate working with semi-additive measures, such as account balances and inventory snapshots. For example, the screenshot below shows LastNonEmtpy in action. To demonstrate this, I added a Last Sales measure to the Internet Sales measure group in the Adventure Works cube and set its AggregationFunction property to LastNonEmpty. Of course, this doesn’t make much sense because sales amounts are fully additive but it’s OK for demo purposes.
As expected, the quarter and year totals show the last non empty sales. The customer totals are correct too because semi-additive measures sum across any dimension except Time. But what about the grand total of $14.98? Shouldn’t we get the sum of the quarter (or year) subtotals?
To answer this question, we need to understand how LastNonEmpty operates. LastNonEmtpy works across time and not across other dimensions. Because the last customer recorded sales are in June 2008, LastNonEmpty gives you Q2 total of $14.98 which becomes the YTD total as well. So, does it make sense to sum the totals vertically? The philosophical answer is “it depends”. If this was inventory balances, the question is why we have missing balances in the last day. In other words, to get the vertical sum right we need to record balances for each product for each period. One may say that in this case LastNonEmpty is correct because it makes no assumptions about what happened to the “missing” values for products, customers, etc. It could be that we didn’t record them or it could be that there we discontinued that their ending balance is indeed not applicable.
But, there could be cases when we need LastNonEmpty to sum vertically instead of getting the last values. For example, the cube may have test scores and you may need to get the last score, such as to calculate the average student or school score. To address this requirement, our first impulse could be to use a scope assignment that overwrites the (Root(Customer), Root(Date)) tuple to server SUM aggregate function (the one you specify in the AggregateFunction property). But, as it stands, SSAS doesn’t support plugging in server aggregate functions in scope assignments.
So, we will try the reverse approach:
Add a new fully-additive measure Sales with SUM aggregate function.
Overwrite the Sum with LastNonEmpty at the customer level.
this = [Measures].[Last Sales]; /*assign Last Sales to Sales to make it semi-additive at customer level*/
EndScope;
Note that [Customer].[Customer].[Customer]. Members exclude the Customer All member. Since the server uses the All member to aggregate up, aggregating at a higher level, such by product will work fine because All member will contain the SUM of the last sales.
It will be great if a future SSAS release supports:
Using server aggregate functions in scope assignments
Give the modeler an option to control the behavior of the semi-additive measures.