Transmissions from TechEd USA 2009 (Day 1)

Day 1 of TechEd 2009 is almost over with the exception of the Community Influencers Party tonight. I heard that this year they expect 7,000 attendees. This is a huge scale-down from previous years. For instance, we had 16,000 attendees at TechEd USA 2007. Economy is hitting everything hard.

I thought the keynote was kind of lame. Judging by it, Microsoft has only three products: Windows 7 (officially announced to ship around holidays although Microsoft didn’t say which holidays), Windows Server 2008 (the buzz is now the forthcoming R2 release), and Exchange Server 2010. Unlike previous TechEds, there wasn’t a single announcement about other products. SQL Server KJ, Office 2010, Azure, dev tools? Nope, apparently not worth mentioning. Sure Mark Russinovich, whom I respect very much, did some cool Windows 7 demos but there were not enough to pique my interest. I understand that OS and Exchange Server are bedrock for every business and after the sad Vista saga, we have to show the world that now we’ll do things right with Windows 7, but the BI soul in me was thirsty for more.

After lunch, I hang around the BI area of the Learning Center, where I answered questions and met with other peers, including Nick Barclay (MVP) whom I wanted to meet personally for a while. Then, I attended the excellent Donald Farmer and Kamal Hathi ‘s Microsoft Project Code Name “Gemini: Self Service Analysis and the Future of BI and I had the chance to see the Gemini, which I blogged briefly about before without knowing too much, for the first time in action and gain more in-depth knowledge.

The Gemini is an end-user oriented Excel add-in that will let the user acquire data from a variety of data sources, including SSRS reports (SSRS KJ will expose reports as data feeds) and SharePoint lists, and load them in an Excel spreadsheet. The tool crunches data very fast even on a modest computer (the demo showed a notebook computer working with millions of rows) thanks to its ability to compress column-level data. This works because a dataset column would typically contain redundant data.

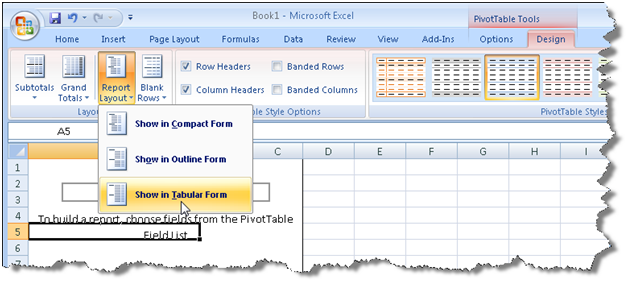
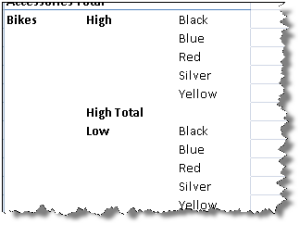
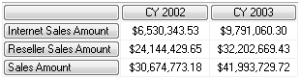
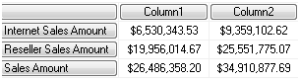
Once data is loaded in Excel, the tool will attempt to automatically determine the relationships between datasets (loaded in separate spreadsheets) to create a hidden dimensional model consisting of fact and dimension in-memory tables. The user will be able to manually specify the dataset relationships by telling the tool which column will be used to join the datasets (very much like joining relational tables). Moreover, the user will be able to define calculated columns using Excel-style formulas. Finally, as the add-in builds behind the scenes an in-memory cube, the user will be able to slice and dice data in a Pivot table report. So, no Analysis Services is needed if all the user wants is manipulating data on the desktop.

Where things are getting more interesting is deploying the models on the server. To do so, the end user would deploy the Excel spreadsheet to the MOSS Report Library. Note that MOSS is required for server-side deployment. When other users request the spreadsheet, an Analysis Services redirector will understand that this is a Gemini model and service the requests from a server cube. At this point is not clear how exactly the server cube will be built and whether it could be managed in SSMS. Once the cube returns data, Excel Services will kick in to return data in HTML. A Reporting Services client can also connect to the server cube by its URL. This is no different than connection to a regular cube as Reporting Services will launch the familiar MDX query designer.

So, where is the IT in the new Gemini world? IT will use a cool MOSS dashboard to understand who’s deployed what model and how the models are used, such as when the datasets were refreshed, what are the most popular models, what resources these models took on the server, etc.

What’s my personal take on Gemini? It’s not up to me to decide how useful it is since it’s a business-oriented tool, such as Report Builder 2.0. Business users will have the final word. Based on my personal experience though, the data analytics problems that I need to solve with traditional Analysis Services cubes surpass the Gemini capabilities by far. So, don’t throw your MDX knowledge out of the door yet. In my line of work, I can see Gemini being useful as a cube prototyping tool, especially in the early stages of requirement gathering where data can be typed in Excel and I can demonstrate to users what a cube can do for them. Of course, Microsoft plans for Gemini are much more ambitious than that. In the ideal world, all business users would upgrade to Office 2010 and create cool Gemini models to give IT folks a long-deserved break ;-). Or, so the fairytale goes….

To wrap up the day, I attended What’s New in Microsoft SQL Data Services presentation by Rick Negrin to find out that SQL Data Services is nothing more than SQL Server running on Microsoft data centers. SQL Data Services will support two application connectivity modes: a “code near” mode where the application (typically a web application) is deployed to Azure and “code far”, where the application will connect to SQL Server over Internet using the TDS protocol. Microsoft role is to provide scalability and failover. Not all SQL Server features will be available in version 1. For example, CLR will not make the cut.

A long and tiring day. I am off to the party now.

SQL Server 2008 Business Intelligence Development and Maintenance Toolkit Available

Today was supposed to be the birthday of the SQL Server 2008 Business Intelligence Development and Maintenance Toolkit by Microsoft Press but it’s not available with retailers, such as Amazon, yet. I guess a couple or so more days as the book is finding its way to resellers.

As with the 2005 version, I was privileged to work together with Erik Veerman and Dejan Sarka (all SQL Server MVPs) on the new revision. My part was the four Analysis Services chapters. Besides updating the book for SQL Server 2008, we re-worked the entire material to flow more logically and make this resource even more useful to help you prepare for the corresponding 70-448 exam.

I hope you’ll find the toolkit useful and pass the exam to certify!

Overwriting Parameter Defaults

Issue: An interesting question popped today on the discussion list about overwriting the default of a cascading parameter. In this particular case, the report has two parameters: Frequency and HireDate. The HireDate parameter is dependent on the Frequency parameter. Specifically, when the user changes the Frequency parameter, custom code changes the default of the HireDate parameter. Sounds easy, right? Well, not so fast.

This requirement calls for smashing the HireDate default. However, smashing values that the user selected (either explicitly or implicitly by not changing the default) is usually considered to be a bad thing. There exist uncommon cases such as this one where the author of the report can reasonably know the user would expect their previously selected value will be overridden. Unfortunately, Reporting Services doesn’t not currently have a feature which would allow the report author to distinguish the common case from the uncommon case. As a result, the current design handles the common case. (Note: In SQL 2000, SSRS defaulted to smashing the user’s selection with the default when an upstream parameter value changed. And, this resulted in a large volume of customer complaints.

Solution: So, what’s the solution? One option you may want to explore, which the sample report demonstrates (attached), if the Valid Values list changes (as a result of the upstream parameter value changing) and it no longer contains the user’s selection, SSRS is forced to re-evaluate the default. Careful use of the Valid Values list can in many cases simulate the desired behavior of always overriding the user’s selection back to the default. This is I set the HireDate available values to the same expression, so its available value always changes.

[View:/CS/cfs-file.ashx/__key/CommunityServer.Blogs.Components.WeblogFiles/blog/parameter_5F00_default.zip]

Microsoft SQL Server 2008 Reporting Services Add-in for Microsoft SharePoint Technologies, April 2009

As I mentioned in a previous blog, one very important SSRS enhancement in the recently released SQL Server 2008 SP1 is Report Builder 2.0 ClickOnce. This lets you reconfigure the native and SharePoint integration modes to let the user use Report Builder 2.0 instead of Report Builder 1.0.

Note that in SharePoint integration mode, installing SP1 only is not enough. That’s because there are actually two instances of RB2.0 ClickOnce. If you install SQL Server 2008 SP1, this will provide an update for native mode only. For SharePoint integration mode, you must refresh the Microsoft SQL Server 2008 Reporting Services Add-in for Microsoft SharePoint Technologies. This is necessary because the ClickOnce bits must reside on the SharePoint server. The April 2009 version of the add-in can be downloaded from here.

SSAS Import Wizard to the Rescue

Sometimes, it’s better just to reset. I came across an issue concerning processing a partition whose containing measure group joins a dimension via another reference dimension. Specifically, when I attempt to process the partition, the server would error out with:

The binding for the ‘dimension key’ column is not a ColumnBinding type

What made this issue interesting is that I was able to repro the issue each time I would process the partition but the Microsoft support engineer, who was assigned to this issue, hasn’t been able to. After some digging we realized that the issue only happens in project mode, that is, when working with the project source in BIDS and deploying to the server.

How do we fix this horrible issue? We reverse-engineer the deployed cube using the SSAS Import Wizard to regenerate the source code.

  1. In BIDS, click File->New->Project.
  2. In the New Project dialog, select Import Analysis Services 2008 (or 2005 depending on the version you have) Database.
  3. Specify the location of the deployed database. BIDS will reverse-engineer the database to its source code.

Magically, after this procedure the error went away although we are still working on finding out what caused the error with the original code.

Excel PivotTable Tabular Reports

Here is a great tip thanks to Greg Galloway who pointed me to the Steve Novoselac’s excellent blog. By default, Excel 2007 PivotTable stacks (hierachizes) the attributes on the report even if they are from the same dimension. For example, let’s say the user wants to slice by the product hierarchy but want also some additional product attributes, such as the product color, size, etc. By default, Excel will produce the following layout:

033109_2111_ExcelPivotT1

Needless to say, this is hardly what the users want to see as they would prefer the product attributes to be displayed in a tabular format. Luckily, this is easy albeit not very intuitive.

  1. Before you drop the first field on PivotTable, click the Design main menu on the ribbon (the one next to Options menu).

033109_2111_ExcelPivotT2

  1. Expand the Report Layout drop-down menu and select Show in Tabular Form. Again, make sure that that PivotTable is empty before you do this.
  2. If you want to remove subtotals, expand the Subtotals drop-down menu and select Do Not Show Subtotals.
  3. Finally, to remove the +/- indicators, right-click on PviotTable and select PivotTable Options. On the Display tab, uncheck the Show Expand/Collapse Buttons.

Then, you can proceed to laying out the report as usual. Now you have a cool-looking tabular report.

033109_2111_ExcelPivotT3

Report Builder – Past, Now and Future

The Report Builder technology made its debut in SQL Server 2005. It targeted business users who wanted to author their own (ad-hoc) reports but they were not necessarily technically savvy, meaning that no technical knowledge about database schemas or query syntax was assumed. The Report Builder technology includes a Report Builder Model and Report Builder Client. Similar to other ad-hoc reporting tools, such as Impromptu, the solution developer was required to implement a Report Builder model that is layered on top of the database and deploy it to the server. This model would receive the reports authored by the end users, which were described in an abstract language (SMDL), and automatically translate them to native queries for the supported data sources (SQL Server, Oracle, and Analysis Services).The initial vision, which didn’t materialize, was to make the query generator open, so developers can plug in custom query generators for other data sources. The Report Builder Client is a ClickOnce desktop report designer which was capable of producing very simple template-based reports.

As Brian Welcker, a former Group Program Manager on the SSRS team, explained in his blog, the Report Builder technology itself enjoyed good acceptance but it wasn’t perfect. To start with, many business users found the Report Builder Client too limiting. Targeting Analysis Services as a data source was problematic to say the least as essentially you had to “wrap” the cube with the Report Builder model layer while a direct access to the cube was preferred. As a result, SQL Server 2008 brought in Report Builder 2.0 which was targeted to supersede the Report Builder Client. As I explained, besides its name Report Builder 2.0 has very little to do with its predecessor as it’s much closer to the BIDS Report Designer than Report Builder 1.0. It provides a full RDL support and shares the same design layout with the BIDS Report Designer but runs outside Visual Studio as a desktop application (ClickOnce-enabled in SQL Server 2008 Service Pack 1).

So, does this mean that the Report Builder technology itself is outdated moving to SQL Server 2008? Absolutely not. If you are looking for an ad-hoc solution that targets small to medium-size SQL Server and Oracle databases, you should definitely evaluate Report Builder. In fact, future releases are expected to bring exciting changes to the Report Builder model which I cannot discuss as they are under NDA. On the report authoring side, business users should evaluate both Report Builder 1.0 (still available in SQL Server 2008) and Report Builder 2.0. Based on my experience, even non-technical users, such as these who struggle with copy and paste, would prefer Report Builder 2.0, so I’d definitely encourage my users to switch to it.

That said, remember that Report Builder is not the only ad-hoc technology that Microsoft provides. As many of you know, I am a big fun of Analysis Services for OLAP and ad-hoc reporting. If you are willing to invest time to learn Analysis Services and MDX (and you should), another approach is to implement a cube instead of a proprietary Report Builder model. If the user needs traditional (banded) reports, they can use the Report Builder 2.0 MDX Query Designer to author such reports from the cube. Of course, one of the advantages of this approach is that Analysis Services enjoys broader client support so you are not limited to Report Builder 2.0 only as a reporting tool. For example, business users can use Excel, ProClarity, and third-party tools. So, choosing a Report Builder model or SSAS is an important decision that requires carefully evaluating your reporting requirements, implementation effort, and skill set.

What may not be so obvious is that if you decide to use a Report Builder model, you can have the best of both worlds: Report Builder model on the server that abstract the database and Report Builder 2.0 client that supports all report authoring features. Unlike the BIDS Report Designer, with Report Builder 2.0 the user doesn’t have to (in fact the user can’t) create a data source that points to the model. Instead, the user wold point to a server Report Builder model when defining the report data source:

  1. In the Report Data pane, click New –> Data Source. Notice that the Data Source Properties dialog says “Use a shared connection or report model”.
  2. Browse to the Report Builder model on the server and click OK.

Once in the query designer, notice that it shows the same Report Builder metadata as in Report Builder 1.0. You have the same entity navigation that guides the user to the entities that are related to the selected entity. From here, authoring a report is a matter of dragging and dropping entities and fields. One thing that is not working in Report Builder 2.0 though, which is likely to be fixed in a future release, is filter prompts. Report Builder Client 1.0 would automatically populate the parameter available values if you select a filter as a prompt. Report Builder 2.0 would generate a report parameter but you have manually set up a dataset for the available values and bind it to the parameter.

Troubleshooting the SharePoint Add-in for Reporting Services Part 2

Today, a co-worker declared a victory after struggling a few days to get Reporting Services 2008 SharePoint integration mode going on Windows Server 2008 (aka Longhorn). I helped of course J

  1. It all started with access denied error when attempting to deploy reports to SharePoint. Navigating to the WSS Central Admin Operations page would reveal however that the Reporting Services section is missing. After n-installs of the RS add-in we realized that something is not right.
    Take-home note: If the Reporting Services section is missing, the Reporting Services add-in failed to install irrespective of the fact that it didn’t report any errors. Bummer No 1.
    Wish No 1: The RS add-in should report errors to users ideally with recommendations.
  2. I asked him to troubleshoot the RS add-in installation following the steps in this blog.

    The most important line from the add-in log file was:

**********  User does not have permissions to add feature to site collection ********

So, the add-in installed the Report Server Integration Feature but it couldn’t activate it although my co-worker used the same account (his Windows account) to install the add-in and he had WSS Farms Administrators rights? Bummer No 2. Welcome to the SharePoint candy land where things are not what they appear to be.
Wish No 2: The farm administrator should have the right permissions to activate features or if he doesn’t have them for whatever reasons, the add-in should report this beforehand.

  1. Activate the feature manually:
    1. Go to SharePoint 3.0 Central Administration.
    2. Select Site Actions -> Site Settings
    3. Under the Site Collection Administration section click Site Collection Features
    4. Activate the Report Server Integration Feature in the list
  2. Run the RS add-in again. This time, no error messages in the add-in log file.

    Success!

    Disclaimer: The issues described above might be Windows Server 2008-specific (we have a tighter security model now, right) or at least I don’t recall having them on Windows Server 2003.


Measures on Rows

Issue: You want an MDX query that returns measures on rows and calculated members on columns. You get The Measures hierarchy already appears in the Axis0 axis error. That’s because calculated members added to measures are treated as measures and you cannot have the same dimension (Measures in this case) on different axes.

Solution: Let’s point out that the above-mentioned error doesn’t occur if you request dimensions on columns. For example, the following is a perfectly legit query:

select {[Date].[Calendar].[Calendar Year].&[2002],

[Date].[Calendar].[Calendar Year].&[2003]} on 0,

{[Measures].[Internet Sales Amount],

[Measures].[Reseller Sales Amount],

[Measures].[Sales Amount]

} on 1

from [Adventure Works]

031409_0126_MeasuresonR1

In addition, you may be able to use the capabilities of the tool to rotate dimensions from columns to rows, such as using a crosstab report layout in Reporting Services. Interestingly, PivotTable in Excel 2007 lets you add measures on rows although behind the scenes Excel requests measures on columns but does an internal rotation to move the measure columns on rows.

However, sometimes you may need asymmetric columns that filter the results. This may force you to use calculated members on columns and measures on rows. Since you cannot put the calculated members on Measures, consider adding them to a dimension. The following query adds Column1 and Column2 calculated members to the Product.Category attribute. Notice that the first column filters the bikes sales for USA only.

with member [Product].[Category].Column1 as ([Product].[Category].[Bikes], [Date].[Calendar].[Calendar Year].&[2002], [Geography].[Country].&[United States])

member [Product].[Category].Column2 as ([Product].[Category].[Bikes], [Date].[Calendar].[Calendar Year].&[2003])

select {[Product].[Category].Column1, [Product].[Category].Column2 } on 0,

{[Measures].[Internet Sales Amount],

[Measures].[Reseller Sales Amount],

[Measures].[Sales Amount]

} on 1

from [Adventure Works]

Of course, you can use any tuple or aggregation function for the member definition. BTW, you can cheat SSRS to bypass the rule that insists that measures must be on columns and the entire validation and preparation goodness by manually entering the query in the report definition and defining the dataset fields and mappings.

031409_0126_MeasuresonR2

Invisible Cubes

I had a head-scratcher the other day. All of a sudden, SQL Server Management Studio stopped showing the cubes in the dropdown of the MDX Query tab although MDX queries and reports would execute just fine. The Reporting Services MDX Query Designer would complain with “No cubes found” error when I attempted to launch it from the dataset properties. This strange behavior coincided with installing SQL Server 2008 SP1 CTP, so I was quick to find a culprit. My suspicion was that the SSAS Windows authentication was failing was some reason although the SQL Server Profiler would show that the right Windows identity was connecting to the database.

To troubleshoot this further, I issued the following schema rowset query when connected to the SSAS database in SSMS:

select * from $system.mdschema_cubes

Interestingly, the query would return a list of the database dimensions (SSAS treats dimensions as cubes and prefix the dimension name with $) but it wouldn’t return the cube name itself. Then, I had a Eureka moment. I went to the Cube Structure tab in the BIDS Cube Designer, and I realized that that somehow I managed to set the cube Visible property to False. Not sure why you would ever want to make the cube invisible and why this property is there to start with but there it was. Flipping it back to True and redeploying the cube fixed the mysterious No Cubes Found error.