Online Analysis Services 2008 Class on May 17th

There is still time to register for the online Applied Analysis Services 2008 class run on May 17th. No travel, no hotel expenses, just 100% content delivered right to your desktop! This intensive 3-day online class (14 training hours) teaches you the knowledge and skills to master Analysis Services to its fullest. Use the opportunity to ask questions and learn best practices.

For more information or to register click here!

Synchronizing Reporting Services Groups

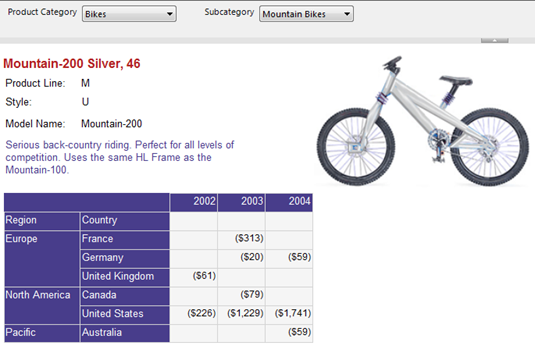
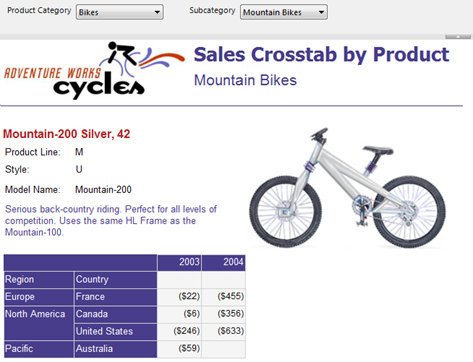
One new R2 feature that I discovered while reading the Reporting Services Recipes book, is group data synchronization. Consider the following report (download the two sample reports here):

050310_2342_Synchronizi1

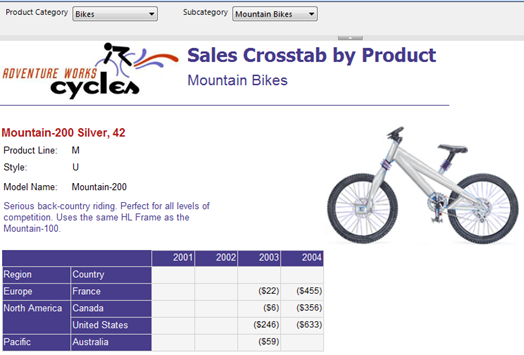
In this report, the matrix region is nested inside a list region. The list region pages (groups) on product while the nested matrx region displays the sales for the current product grouped by region and year. As you can see, Mountain-200 Sliver, 42 has data for years 2003 and 2004 but if you move to the next page, you will see that Montain-200 Silver, 46 has sales for 2002, 2003, and 2004.

050310_2342_Synchronizi2

What if you want to synchronize the instances of the matrix region to return the same number of columns, which in this case would it all available years in the dataset? In R2, this takes a few clicks.

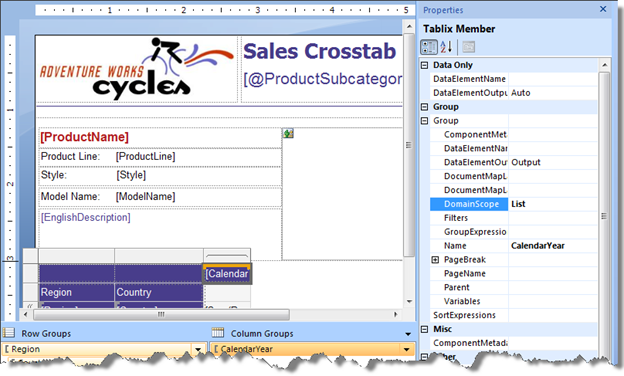
  1. In design mode, click anywhere inside the nested matrix region so the Groups pane shows its groups.
  2. Select the CalendarYear column group on which the matrix region pivots.
  3. Expand the Group section in the Properties window and enter the name of the outer region in the DomainScope property. In this case, the outer region is the list region whose name is List.

050310_2342_Synchronizi3

Now, when you run the report, all instances of the matrix region are synchronized and have the same number of columns irrespective of the fact that they might not have data for given years.

050310_2342_Synchronizi4

DomainScope is similar to expression scope but not the same. DomainScope can be set on a group leaf member only. So, if the matrix region was grouping on years and quarters, you can synchronize quarters only in which case each year would show four quarters. You cannot synchronize the Year level because it’s a parent group. In addition, the domain scope can be an outer group or region. Unlike expression scopes, you cannot synchronize on a dataset.

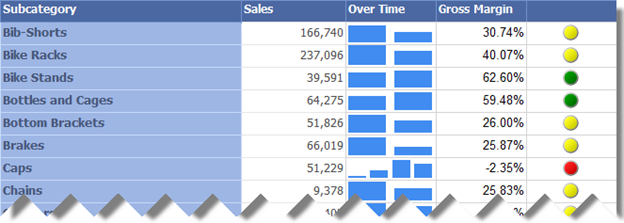
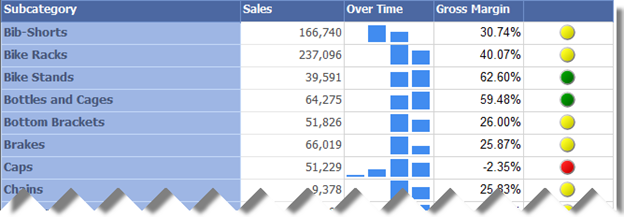
Group synchronization comes also handy when you work with sparklines. For example, the following report includes an Over Time column that shows a bar sparkline for product category sales over years.

050310_2342_Synchronizi5

As you can see, the Caps category has sales for four years (The AventureWorksDW2008 database has data for years 2001-2004), while Bib-Shorts category has data for two years. However, the sparklines groups are not aligned. For instance, you can’t tell which two years Bib-Shorts have sales for. To fix this:

  1. Double-click the sparkline region to show the Chart Data window.
  2. Click the CalendarYear group and set the DomainScope property to the name of the containing tablix region, Tablix1 in this case.

050310_2342_Synchronizi5

Now, when you run the report, you’ll see that the sparkline group ordinal position reflects the year. Thus, knowing the range of available years (2001-2004) which for clarity you can display on the report, e.g. as a subtitle, Bib-Shorts have data for years 2002 and 2003, while Bike Racks have data for 2003 and 2004.

050310_2342_Synchronizi7

Book Review – Microsoft SQL Server Reporting Services Recipes

This is a review of the latest addition to the long repertoire of Reporting Services books – Microsoft SQL Server Reporting Services Recipes (ISBN: 978-0-470-56311-3). When you learn a new technology you suggest you pick up several books covering this product because every author writes from his own experience. Thus, even books covering the same technology are not competing by completing each other. Some books target novice users, others are more advanced; some have a strong practical connotation while others are designed to be used more as a reference.

In my opinion, this book will benefit mainly readers who have worked with Reporting Services and have already some report authoring experience under their belt. If you fit this profile, you probably find yourself occasionally wanting a report sample that addresses a specific requirement, a tip for better implementation, or a trick to get around a given limitation. Continuing this line of thought, another title for this book might have been “Reporting Services Tips and Tricks”.

Two author names appear on the book cover – Paul Turley and Robert Bruckner – and both names should be familiar to you. Both authors have been heavily involved with Reporting Services since its inception. Paul is a SQL Server MVP and BI architect for Hitachi Consulting. Robert is a technical lead with the Reporting Services team and when he speaks I take a note. Both authors have helped the community tremendously by answering questions on the Reporting Services discussion list, writing and blogging about Reporting Services, and speaking at industry events. Some of the book material has been contributed by other Hitachi employees and SQL Server experts. The foreword is written by Thierry D’hers – Group Program Manager with the Reporting Services team.

The good thing about this book is that it’s not tied to a particular release of Reporting Services. What I particularly liked is that in some cases the authors have provided examples that work with previous editions of Reporting Services, coupled with versions that benefit from the latest features found in 2008 or R2. The book is organized in the following parts:

  • Introduction (80 pages) – Provides the necessary foundation for report authoring.
  • Part 1: Columnar and Grouped Reports (50 pages) – This part covers features that every report author should know, including alternative row colors, dynamic groups, conditional column visibility, and resetting page numbers.
  • Part 2 : BI Dashboards and Elements (30 pages) – This is where you would learn to work with indicators, sparklines, charts, and other elements to author dashboard pages that are becoming increasingly popular. You will also learn interesting tips to integrate your reports with Analysis Services.
  • Part 3: Chart and Gauge Reports (60 pages) – Think of this part as how to get the most out of the Reporting Services data visualization features. It walks you through the cornucopia of chart types that SSRS 2008 made possible, such as histogram, Peretto, bullet graphs, and gauges. It teaches you how to enhance these charts with custom color palettes and exception highlighting.
  • Part 4: Interactive Reporting (40 pages) – Reporting Services has supported interactive features since the beginning, such as drillthrough, toggled visibility, links, bookmarks, etc. This part takes the interactive features to the next level by showing you how to implement conditional linking, breadcrumbs, dynamic pivoting and document maps.
  • Part 5: Integrated Reporting Applications (35 pages) – This part shows you how to build report solutions that go beyond a single report, such as conditional subreports, changing the data behind the report, and embedding reports in .NET applications.
  • Part 6: Enhanced Report Content (100 pages) – This part covers advanced report authoring techniques, including mailing labels, barcodes, custom aggregation, dynamic page breaks, external images, checkbox list and mapping (a new feature of R2).
  • Part 7: Filtering and Parameterization (70 pages) – Report parameters is one area that takes a lot of criticism from the community and it’s one of the weakest links of Reporting Services. The authors present several workarounds for common requirements and limitations, such as advanced filtering, handing multi-valued parameters, top ranking, and custom sorting.
  • Part 8: Custom and Dynamic Data Sources (30 pages) – This section shows advanced techniques for data retrieval, such as obtaining data from a web service, SharePoint lists (2008 and R2), and Dynamics AX.
  • Part 9: Games (15 pages) – Now that you’ve learned all these cool tricks, it’s time to chill out. If Xbox is not cool anymore, Reporting Services is here for you to play and delight your users with games such as hangman, and sea battle. Hallo is coming soon… just kidding.

In a nutshell, pick up this book. You’ll find yourself reaching for it on a regular basis.

043010_2244_BookReviewM1

Scope Assignments and Missing Members

The Analysis Services server parses the cube script on deploy and complains in case of missing dimension members. You can use the IsError() function to handle missing members, such as Iif(IsError([Account].[Accrual Basis].&[30/360]), null, ([Account].[Accrual Basis].&[30/360]). However, sometimes you might want to ignore the default missing member behavior. For example, an ISV deploying a cube to different customers might prefer to ignore missing members if there are many member references in the cube. In this case, you can see the ScriptErrorHandlingMode cube-level property to IgnoreAll. The unfortunate side effect of doing so is that any scope assignment that references a missing member will be invalidated. For example, suppose you have the following scope assignment:

Scope

    (

        [Account].[Account].[Account].Members,

        {[Account].[Status].&[Open], [Account].[Status].&[Pending]},

    );        

    this =  … ;

End
Scope;

This assignment changes the cube space for all accounts with Open and Pending status. But what happens if the [Account].[Status].&[Pending] member doesn’t exist? The scope assignment simply doesn’t work. Since in this case, a set is used to specify the account status, you cannot use IsError(). One workaround is to use the Filter() function as follows:

Scope

    (

        Filter([Account].[Account].[Account].Members, [Account].[Account].Properties(“Status”) = “Open” OR [Account].[Account].Properties(“Status”) = “Pending”)

   );        

    this =  … ;

End
Scope;

Reporting From OData Services

Open Data Protocol (OData), previously known as ADO.NET Data Services, is quickly gaining popularity as a web protocol for querying and updating data. A few Microsoft products already expose their functionality as OData services, including SharePoint 2010, SQL Azure, and Reporting Services (see my blog about reports as data feeds). Therefore, chances are that you may need to report off OData services. As it stands, Reporting Services doesn’t include a native support for OData but the XML Data Provider, which has been around since version 2005, may get the job done.

The OData report demonstrates how you can use the XML Data Provider to query OData services. It has two datasets. The Customers dataset retrieves data from the sample Northwind OData service. The CompanySales dataset queries the Adventure Works Company Sales report as a data feed.

Northwind OData Service

The Northwind datasets shows a list of Northwind customers. I implemented the report as follows.

  1. Set up the Northwind data source that uses the XML Data Provider and whose connection string points to the Northwind Customers service.
    http://services.odata.org/Northwind/Northwind.svc/CustomersAs you’ve probably guessed it, you need to set up a data source for each OData service you want to query. If you open the above link in IE with the feed view turned off (Internet Options, Content tab, Settings, uncheck Turn On Feed Reading View), you will see the output of the service.

    <?xml version=”1.0″ encoding=”utf-8″ standalone=”yes” ?>

<feed xml:base=”http://services.odata.org/Northwind/Northwind.svc/
xmlns:d=”http://schemas.microsoft.com/ado/2007/08/dataservices
xmlns:m=”http://schemas.microsoft.com/ado/2007/08/dataservices/metadata xmlns=”http://www.w3.org/2005/Atom“>

  <title type=”text“>Customers</title>

  <id>http://services.odata.org/Northwind/Northwind.svc/Customers</id>

  <updated>2010-04-25T15:07:07Z</updated>

  <link rel=”self title=”Customers href=”Customers” />

<entry>

  <id>http://services.odata.org/Northwind/Northwind.svc/Customers(‘ALFKI’)</id>

  <title type=”text” />

  <updated>2010-04-25T15:07:07Z</updated>

<author>

  <name />

  </author>

  <link rel=”edit title=”Customer href=”Customers(‘ALFKI’)” />

  <link rel=”http://schemas.microsoft.com/ado/2007/08/dataservices/related/Orders type=”application/atom+xml;type=feed title=”Orders href=”Customers(‘ALFKI’)/Orders” />

  <link rel=”http://schemas.microsoft.com/ado/2007/08/dataservices/related/CustomerDemographics type=”application/atom+xml;type=feed title=”CustomerDemographics href=”Customers(‘ALFKI’)/CustomerDemographics” />

  <category term=”NorthwindModel.Customer scheme=”http://schemas.microsoft.com/ado/2007/08/dataservices/scheme” />

<content type=”application/xml“>

<m:properties>

  <d:CustomerID>ALFKI</d:CustomerID>

  <d:CompanyName>Alfreds Futterkiste</d:CompanyName>

  <d:ContactName>Maria Anders</d:ContactName>

  <d:ContactTitle>Sales Representative</d:ContactTitle>

  <d:Address>Obere Str. 57</d:Address>

  <d:City>Berlin</d:City>

  <d:Region m:null=”true” />

  <d:PostalCode>12209</d:PostalCode>

  <d:Country>Germany</d:Country>

  <d:Phone>030-0074321</d:Phone>

  <d:Fax>030-0076545</d:Fax>

  </m:properties>

  </content>

  1. Set up a dataset query.

    <Query>

        <ElementPath IgnoreNamespaces=”true”>

            feed{}/entry{}/content{}/properties

        </ElementPath>

    </Query>


    The IgnoreNamespaces attribute instructs the provider to ignore the XML namespaces. The ElementPath text specifies a path to the element whose nodes you want to display. In this case, the element is properties which is the element that contains the interesting OData stuff. The empty curly braces for the preceding nodes are used to ignore information from the preceding nodes in the path.

CompanySales

Since starting with R2, reports are available as data feeds, you may also implement a quick and easy way to display data from one report in another. In this blog, I provided more details about the query syntax. In the case of the Company Sales, the data source connection string is as follows:

http://localhost/ReportServerR2?/Adventure Works Sample Reports/Company Sales 2008&ShowDescription=False&StartDate=01/01/2002 00:00:00&EndDate=12/31/2003 00:00:00&rs:ParameterLanguage=&rs:Command=Render&rs:Format=ATOM&rc:DataFeed=xAx0x2xCx0xMx0

The dataset query is the same because all OData services return data in the same format.

Moving forward, it will be nice if a future release includes a native OData provider that handles parameters and supports methods, as the XML Data Provider does for SOAP web methods, so you don’t have to set up a data source for each OData service.

Debugging SSIS Script Tasks on x64

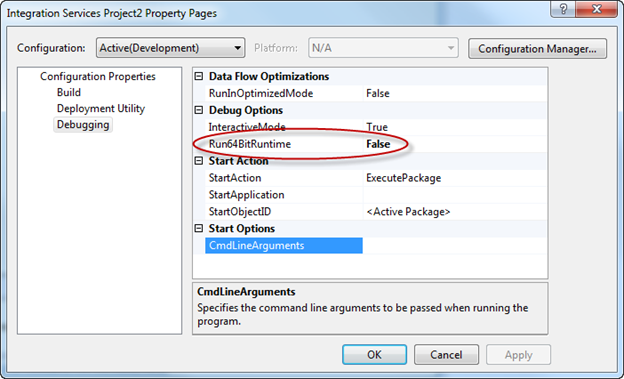
A coworker of mine complained that Integration Services doesn’t let you debug script tasks on x64. I found an easy workaround to disable the x64 runtime.

  1. Right-click the project node and click Properties.
  2. Switch to the Debugging tab and change the Run64BitRuntime to False.

042410_0014_DebuggingSS1

Hit F5 and breakpoint will be hit.

SQL Server 2008 R2 Released to Manufacturing

Robert Bruckner announced that SQL Server 2008 R2 was released to manufacturing today. Robert summarized the most important most features. I covered them in my blog as well. I’ll update this blog once I find out when R2 will be available on MSDN.

UPDATE

According to this Microsoft blog, R2 will be available for MSDN subscribers on May 3rd.

Using XPerf to Test Analysis Services

I have to admit that I am a performance buff. In a previous blog, I mentioned that the Xperf utility can help you gain additional understanding about the Analysis Services performance. Akshai Mirchandani from the SSAS team was kind enough to share his performance testing experience and recommended this utility. It turns out he was right – it is a real gem! Just after writing that blog, an opportunity presented itself. A business user complained that drilling down a member in an Excel PivotTable report takes about 20 seconds on a virtual test server. This inspired me to take XPerf for a spin. In this case, the database was relatively small but the user has requested two parent-child dimensions on the report with some 3,500 and 300 members each. As you probably know, parent-child dimensions are slow by nature. To make things worst both dimensions had many-to-many relationships. The SQL Profiler would show that almost the entire time was spent reading data from partitions. However, I was interested to find out how much time was spent in actual I/O vs. aggregating data to make specific performance recommendations. The findings were interesting. Here are the steps I followed to test the performance using XPerf on the virtual server running Windows Server 2008:

  1. I downloaded the Microsoft Windows SDK for Windows 7. Although it’s for Windows 7, it can run on Windows Server OS as well. When I ran the web install, I selected the Win32 Development Tools option only to reduce the size of the download.
  2. Once installed, I ran Install Windows Performance Tool Kit (x64) found in the Microsoft Windows SDK v7.0 -> Tools program group and accepted the default options.
  3. I ran the command prompt with elevated privileges (Run As Administrator) and started a trace with the default configuration.
    C:\Program Files\Debugging Tools for Windows (x64)>xperf -on DiagEasy
  4. In Excel, I drilled down to expand a member of one of the parent-child dimensions that was particularly slow.
  5. Once Excel was done executing the query, I stopped the trace and saved the results in a file mytrace.etl.
    C:\Program Files\Debugging Tools for Windows (x64)>xperf -d mytrace.etl
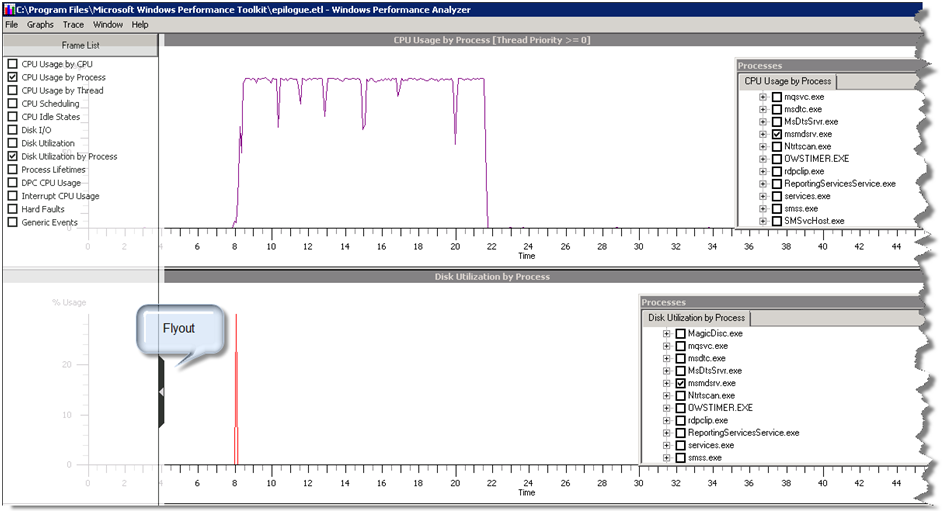
  6. Double-clicked the mytrace.etl file which was saved in the C:\Program Files\Microsoft Windows Performance Toolkit folder to open in the Windows Performance Analyzer. This is where the fun starts!

    041610_2234_UsingXPerft2

  7. Since I was interested in disk utilization and CPU usage, I clicked on the Flyout glyph and checked these options to have two graphs only.
  8. On each graph, I expanded the Processes panel and left only msmdsrv.exe checked to filter the trace results for Analysis Services server only.

    At this point, I couldn’t believe my eyes! As you could see, the server spent a fraction of a second to read from disk. The remaining time was spent in number crunching to aggregate the results. To see the actual metric, I selected the I/O peak, right-clicked and clicked Summary Table. This showed that the server spent 29ms to read only 118,784 bytes from disk which makes sense (as I said the database is small). In summary, this particular case could benefit much more from more CPU power and potentially more CPUs since the storage engine is highly parallel.

    041610_2234_UsingXPerft3

    As you can see, Xperf can help you gain important performance details that are not available in SQL Profiler. In this blog, I only scratched the surface of what XPerf can do for you. One very interesting feature is stack walking that gives you a breakdown in time spent per function call assuming you have the debug symbols loaded. The stack waking feature is explained in more details in this Windows Performance Toolkit – Xperf blog. Of course, it could have been nice if the SQL Profiler gives you more detailed tracing information so you don’t have to rely on Xperf, e.g. Reading Data From Disk Begin/End, Data Cache Population Begin/End, Storage Engine Work Begin/End, Formula Engine Work Begin/End. So, vote here.

Speaking at Atlanta.MDF

I will be speaking at the Atlanta Microsoft Database Forum group (Atlanta.MDF) on May 10th in Atlanta, GA . The topic will be What’s New in Reporting Services 2008 R2. Given that SQL Server 2008 R2 (aka SQL Server 2010) will be released in May, timing is good. This is your chance to learn about and see the cool new features in action, ask tough questions and literally put me on the spot. Save the date in your calendar.

Date: 5/10/2010

Time: 6:30 PM – 9:00 PM

Place:Microsoft, 1125 Sanctuary Pkwy., Suite 300, Alpharetta, GA 30004

Analysis Services I/O Time

A couple of years ago I was working on a KPI dashboard project where we had to display a bunch of KPIs produced by counting (distinct count) number of customers, accounts, etc. Even with SSAS 2008 we couldn’t much to optimize the queries to render the page in a few seconds because we found that 50% of the execution time was spent in the storage engine. We flirted with the idea of using solid state disks (SSD) but back then there were not that popular.

A recent feedback from other MVPs and members of the SSAS team suggests that in general SSD are favorable for optimizing the SSAS I/O performance. As you would imagine, the more time the Storage Engine (SE) spends in reading data from disk, the more performance improvement you would expect by switching to faster disks. But then the question becomes how much time SSAS really spends reading data from disk. As it turns out, the SQL Profiler doesn’t give you the answer. That’s because the Started/Finished reading data from the partition events include also the time spent in aggregating data and this time may be significant especially in the case of parent-child or many-to-many dimensions. So, judging from the SQL Profiler alone, you may think that most of the query time is spent in I/O where faster disks may help while it may turn out that you may need more CPU power.

Since as it stands the SQL Server Profiler doesn’t break down the SE time, you need to rely on Windows performance counters to find how much time was spent in actual I/O. Event Tracing for Windows (ETW) can give you such information. For example, on Windows 2008 and Windows 7 you can use the Xperf tool from the Windows Performance Toolkit. The following resources should get you started with Xperf:

Windows Performance Toolkit – Xperf

Using Xperf to take a Trace

Two Minute Drill: Introduction to XPerf

As you will find out, the information emitted by XPerf could be overwhelming to answer a simple question. I posted a feedback on connect for a future release of SSAS to include more detailed tracing about the SE inner workings. This information should be available in SE so it shouldn’t be that difficult to break down the Progress Begin/End reports so customers know if they should scale up in terms of CPU or I/O. Please vote for it if you find it useful.

http://connect.microsoft.com/SQLServer/feedback/details/550431/provide-more-detailed-strorage-engine-trace