2015 Annual TI Forecast by TEKsystems

TEKSystems has been a wonderful sponsor of the Atlanta MS BI Group. They’ve recently published an interesting 2015 Annual TI Forecast report. According to the report, Business Intelligence/Big Data will be among the top most impactful technologies in 2015. More key facts:

  • Seventy-one percent of IT leaders report confidence in their ability to satisfy business demands in 2015, representing an increase from 66 percent and 54 percent in forecasts for 2014 and 2013, respectively.
  • The top five areas where most IT leaders expect to increase spending in 2015 include security (65 percent), mobility (54 percent), cloud (53 percent), BI/Big Data (49 percent) and storage (46 percent). Twenty-nine percent of IT leaders also expect to increase spending on ERP.
  • Seventy-three percent of IT leaders indicate that operational objectives such as reducing costs, improving efficiency, consolidating, standardizing and streamlining present the biggest organizational challenges.
  • Salary increases are most likely to be average, with 68 percent of IT leaders saying that they expect overall staff salaries to increase by up to 5 percent. Only 8 percent expect increases of 6 percent or more and 21 percent expect salaries to remain the same.
  • Hiring expectations have also slowed. Entering 2014, 47 percent of IT leaders expected an increase in full-time IT staff hiring. Entering 2015, just 40 percent expect an increase, and 50 percent expect it to be the same as 2014.

Atlanta MS BI Group Meeting Tonight

Come and join us tonight for last 2014 meeting of the Atlanta MS BI Group. In the spirit of the season, I’ll revisit its most important tools and their role in a holistic and modern data analytics environment. Then, for each tool, I’ll discuss its indented use, as well as its pros and cons. We’ll discuss self-service and organizational BI, on-premise and cloud, emerging technologies, and how they complement each other in the context of Microsoft BI. And, Mark Tabladillo will do us a cool demo of the Azure Machine Learning Web Service. $60 Pizza Hut gift card and other cool door prices from Aspen Brands will be given away. Kudos to our fantastic sponsor TEKSystems for buying us food and drinks!

Embedded Power View and Pivot Reports

I’ve been pestering Microsoft for years to provide an embedded Analysis Services Viewer control (similar to the SSRS ReportViewer) that would allow developers to embed interactive reports on custom Windows Forms and web applications. And, for years nothing happened, even after Microsoft acquired the Dundas OLAP Chart control in 2008. There are some positive signs on that end lately. Microsoft just rolled out the ability to embed Power View and pivot reports on a webpage or blog. I’m sure there are some scenarios that will be benefit from this feature but this is really not what I want because:

  1. It’s just an URL-based mechanism targeting deployed reports and its customization options are limited to layout adjustments.
  2. It’s not a control that developers can customize, such as to change the connection string in order to pass custom user credentials, replace parameters, etc.
  3. It requires the reports to be hosted in Office 365. Hence, at least for now, this feature can’t be used with on-prem data.

SQL PASS Summit 2014 Links

Don’t miss the gist of SQL Pass Summit 2014.

Keynote Day One: http://www.sqlpass.org/summit/2014/PASStv.aspx?watch=7Pum0vfYtSk

Keynote Day Two: http://www.sqlpass.org/summit/2014/PASStv.aspx?watch=g8DSwPjmLv4

All PASStv sessions can be found here: http://www.sqlpass.org/summit/2014/PASStv.aspx

Presenting at Dama-Georgia and Atlanta BI Group

I’ll present at DAMA Georgia Chapter on November 12. The topic will be “Best Practices for Establishing a Solid BI Foundation”. For more details, please visit the event page.

Don’t know where to start with BI or if you’re on the right track? Just like everything else, a successful BI rollout is based on a solid foundation. Targeting BI managers, technology officers, and architects, this advisory and technical session presents proven best practices to implementing BI for mid-size and large organizations. I’ll present approaches and recommendations for the main layers of the BI architectural stack, ranging from staging databases, data marts and warehouses, semantic layers, and reporting tools. We’ll discuss self-service and organizational BI, Big Data, and emerging technologies, and how they complement each other. Some of the concepts will be accompanied by demos using the Microsoft BI stack.

Then, on December 15th, I’ll present “Microsoft BI 2014 Review” at the Atlanta BI Group.

In the spirit of the season, join us to reflect on the state of Microsoft BI Platform at the end of year 2014. I’ll revisit its most important tools and their role in a holistic and modern data analytics environment. Then, for each tool, I’ll discuss its indented use, as well as pros and cons. We’ll discuss self-service and organizational BI, on-premise and cloud, emerging technologies, and how they complement each other in the context of Microsoft BI.

If you are in Atlanta, I hope you can join me to talk data analytics.

Operational BI with Azure Stream Analytics

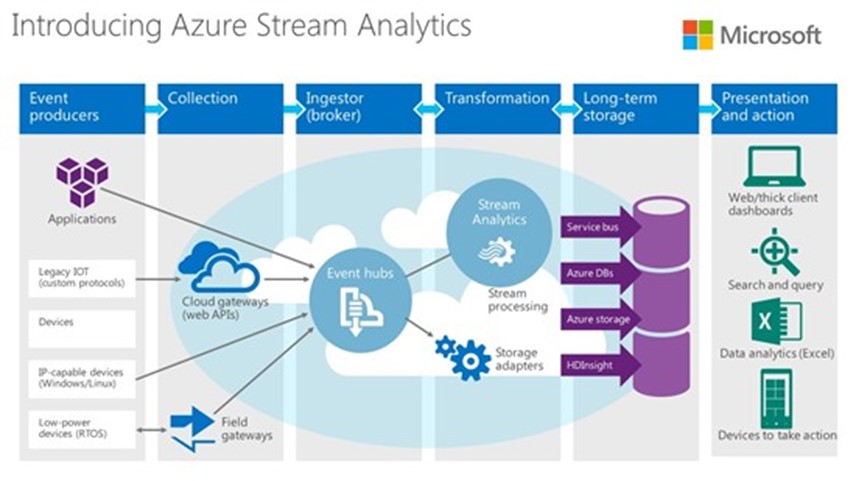
There is a lot of talk nowadays about Internet of Things (IoT). According to Gartner, there will be nearly 26 billion IoT devices by 2020. Naturally, the data generated by these devices needs to processed and analyzed, very often in real time. Indeed, an increasing number of customers need real-time (operational) analytics performed over a stream of events, such as data coming from sensors, barcode readers, social streams, and all sorts of other devices. Currently, .NET developers could use SQL Server StreamInsight to implement on-premise custom CEP (complex event processing) solutions. However, implementing StreamInsight-based applications is not easy as it requires solid .NET and LINQ skills.

Today, Microsoft announced the public preview of the Azure Stream Analytics service that allows organizations to perform stream analytics in the cloud. What’s interesting is that Microsoft made a significant effort to simplify CEP with the promise that “you can be up and running in minutes”. To that end another cloud service, Azure Event Hubs, simplifies the process of intercepting (sinking) events. And, instead of using .NET LINQ, developers can use Stream Analytics Query Language which has a SQL-like syntax for coding standing queries over the event streams, such as:

SELECT DateAdd(second,-5,System.TimeStamp) as WinStartTime, system.TimeStamp as WinEndTime, DeviceId, Avg(Temperature) as AvgTemperature, Count(*) as EventCount FROM input GROUP BY TumblingWindow(second, 5), DeviceId

At the same time, Azure Stream Analytics preserves the advanced features of StreamInsight, such as windowing. The results of the standing queries can be saved to Azure SQL Database, Azure Blob storage, and Azure Event Hub, for further analysis, such as by using Excel. For more information about Azure Stream Insight and to subscribe for the public preview, visit the service home page.

103014_0141_Operational1

I’m excited and expect to see a lot of interest around the Azure Stream Analytics service. If this sounds interesting and you need help, as a Microsoft Gold Partner and premier BI firm, Prologika can help you get started in a cost-effective way, such as by using your Software Assurance vouchers to deliver consulting services around data analytics, such as to implement a POC.

Atlanta MS BI Group Meeting on Oct 27th

Join us on Monday, October 27th for our next meeting of Atlanta MS BI Group to learn about predictive analytics and how to actually do it.

Presentation:Mine Craft
 Level: Intermediate
Date:Monday, October 27th, 2014
Time6:30 – 8:30 PM ET
Place:South Terraces Building (Auditorium Room)

115 Perimeter Center Place

Atlanta, GA 30346

Overview:Why you should be mining your data and how to actually do it. Every company needs a rock star. We want it to be you. This session will give real world examples of data mining successes as well as walk you through how to get started down the path of data enlightenment, so that you too can say “I Am A Data Miner℠”.
Speaker:Mark Tabladillo provides enterprise data science analytics advice and solutions. He uses Microsoft Azure Machine Learning, Microsoft SQL Server Data Mining, SAS, SPSS, R, and Hadoop (among other tools). He works with Microsoft Business Intelligence (SSAS, SSIS, SSRS, SharePoint, Power BI, .NET). Mark has a national leader in analytics and data science (data mining and machine learning) through conference speaking and instructional leadership since 1998. He connects with people on LinkedIn and Twitter @marktabnet.

David McFarland is a Senior Manager Business Intelligence with RentPath, Inc. David spends the vast majority of his day trying to get out of useless meetings. He has no certifications whatsoever and is pretty sure Microsoft has no idea who he is, except when it’s time to renew enterprise software agreements.

Sponsor:Tegile
With demand growing for bigger data and faster service, your data storage choices can make or break your business. Accelerate your business with Tegile’s all-flash and hybrid storage solutions.

Sybase Integration

A Major League Baseball team engaged us to implement the foundation of their data analytics platform. They partner with TicketMaster for ticketing and sales. Interestingly, besides the TicketMaster cloud hosting that everyone is familiar with, Ticketmaster also offers a client application called Archtics to allow customers to sell tickets on premise. The client application uses a Sybase database (as you probably know, Sybase was acquired by SAP) that syncs with the host. Fortunately, Sybase and SQL Server has a lot in common but in the process we had to figure out a way to pull data from the Sybase database. To do so, you need to follow these steps:

  1. Install the SQL Anywhere Database Client Download. During development, you will need the 32-bit driver because BIDS/SSDT is a 32-bit app. When running via SQL Server Agent, you’ll need the 64-bit driver.
  2. Create an ODBC data source. Again you need to create two ODBC data sources using the 64-bit ODBC Administrator and then 32-bit ODBC Administrator.
  3. Use the ODBC Source in SSIS to extract data from Sybase. Unfortunately, the ODBC Source doesn’t support parameterized statements, such as to extract data incrementally. As a workaround, you can use an expression-based SQL command text. You can do this by clicking on the Data Flow task in the package control flow and setting up an expression for the SQLCommand property.

    101914_2246_SybaseInteg1

Looking for Talent

We have two contract positions in Alpharetta, GA. Contact us at info@prologika.com if you are interested.

BA ANALYST (4-MONTH CONTRACT)

Reviews, analyzes, and evaluates business systems and user needs. Documents requirements, defines scope and objectives, and formulates systems to parallel overall business strategies. May require a bachelor’s degree in a related area and 4-6 years of experience in the field or in a related area. Familiar with relational database concepts, and client-server concepts. Relies on experience and judgment to plan and accomplish goals. Performs a variety of complicated tasks. May lead and direct the work of others. A wide degree of creativity and latitude is expected. Typically reports to a manager.

CLIENT-SERVER TABLEAU DEVELOPER (1 YEAR CONTRACT)

Reviews, analyzes, and modifies programming systems including encoding, testing, debugging and installing to support an organization’s client/server software applications. May require a bachelor’s degree in a related area and 4-6 years of experience in the field or in a related area. Familiar with relational database concepts, and client-server concepts. Relies on experience and judgment to plan and accomplish goals. Performs a variety of complicated tasks. May lead and direct the work of others. Typically reports to a project leader or manager. A wide degree of creativity and latitude is expected. Specialty in Tableau dashboards/reporting.

Applied Excel and Analysis Services e-Learning Course Available

BI solutions typically include a semantic layer. In Microsoft BI, the role of a semantic layer is fulfilled by Multidimensional cubes or Tabular models, whose virtues I extolled in this newsletter. If you invested in an SSAS model already, congratulations! You’ve done the lion’s share. But as you know, the next step is to train your business users and get them all excited about BI. This is not a simple task. And, if you plan to use Excel to offload reporting effort, the task is even more difficult because Excel is packed with BI features. This is why I put together a recorded e-learning “Applied Excel and Analysis Services” class. Having more than 5 hours of video content, the class sells for only $120 per student. And, if you use coupon PROLOGIKA-EXCEL-1 by end of October, you can get it for only $90.

To BI managers and BI developers: You’ve implemented an organizational Analysis Service model. Now you need to choose a tool for interactive data analytics and train your users. As you know, there is a proliferation of Business Intelligence tools on the market and each claims to solve your challenges. But the chances are that you already have what you need – Microsoft Excel. And, as far as the documentation goes, who has time to document all Excel BI features and demo them to users? I designed this class to help you empower your users and get them excited about BI with Excel and Power Pivot.

To business users: If your organization have Analysis Services Multidimensional cubes or Tabular models and you want to gain valuable insights from them, then this course is for you. Designed as a step-by-step tour, this course teaches you how to become a data analyst and unlock the hidden power of data. You’ll learn how to apply the Excel desktop BI capabilities to create versatile reports and dashboards for historical and trend analysis. You’ll learn also how to share your BI artifacts across the organization by publishing them to SharePoint. “I never knew Excel can do this” is the most common feedback we hear from our students.

The class curriculum and promo video is also available on the Prologika website.

Enjoy!