Drill Your Way with Power View

Although it might not be immediately obvious, Power View supports various options for exploring data in more details. Although some scenarios are not natively supported, workarounds could be available.

Drilling Down

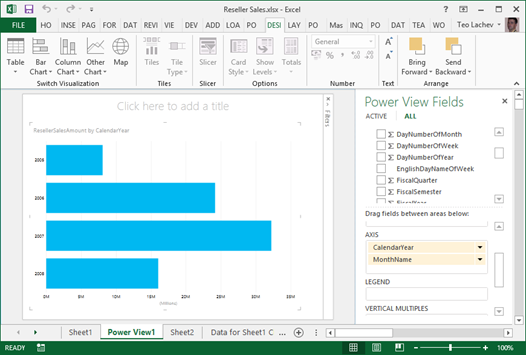
Drilling down involves navigating through multiple fields from the same or different dimensions to explore data at a lower granularity. Every interactive tool supports drilling down (and drilling up) and Power Pivot is no exception. For example, if you have a visualization that has multiple fields in a given zone, such as the AXIS zone, you can double-click a series to drill down to the next level. In the example below, I can double-click the Year series to see the data by Month.

021114_2308_DrillYourWa1

Drilling down is not automatically enabled for Table and Matrix visualizations because by default they show all fields in separate columns. What if you want one column but still be able to drill down?

  1. If you haven’t done this already, convert the Table visualization to a Matrix visualization.
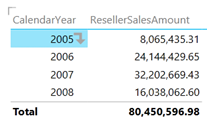
  2. Expand the Show Levels button and click “Rows-Enable Drill Down One Level at a Time” assuming you want to drill down on fields placed on rows.

021114_2308_DrillYourWa2


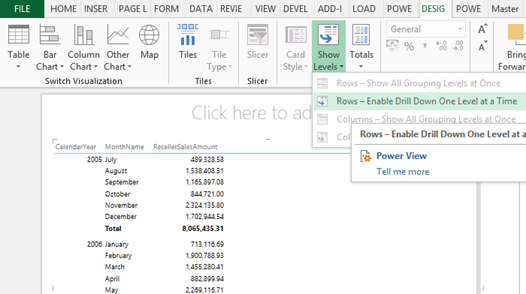
This will collapse all row fields to a single column. However, when the user clicks a field value, a down arrow indicates that this field is drillable. The user can click the arrow or double-click the field value to drill down or up if the field has been drilled to a lower level already.

021114_2308_DrillYourWa3

Drilling Through

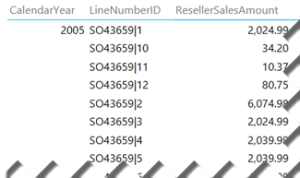
While drilling down is typically performed in the context of dimension tables, drilling through allows the user to see the details behind an aggregated value which is typically a numeric measure from a fact table. For example, Analysis Services and Power Pivot supports default drillthrough allowing the user to double-click on a cell in an Excel pivot report to see the individual rows as they were loaded from the data source, such as the sales transactions loaded from a ResellerSales fact table. As it stands, Power View doesn’t support Analysis Services actions and the user cannot double-click an aggregated value, such as on a field placed in the Values zone. Nor it allows the report to be extended with additional SSAS actions.

If you want to see the individual rows and the table includes a unique identifier, such as Transaction ID, you can simple drag that field on the Rows zone of a Table or Matrix report. If the table doesn’t have a unique identifier, you can manufacture one by concatenate multiple columns together. For example, the LineNumberID field in the screenshot below uses the DAX expression =[SalesOrderNumber] & “|” & [SalesOrderLineNumber].

021114_2308_DrillYourWa4

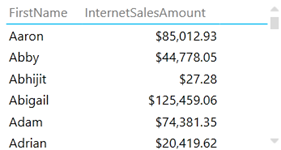
Sometimes, you may have duplicate field values, such as two customers who have the same first name. By default, Power View will show the distinct values and aggregate the results. For example, the following report shows a single row for Aaron although there are multiple customers whose first name is Aaron.

021114_2308_DrillYourWa5

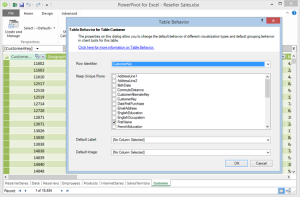
The modeler can use the Power View Table Behavior feature to instruct the client tools not to aggregate results across specific fields. For example, with the changes shown in the following screenshots, the report now will show as many Aaron rows as the number of customers that have Aaron as a first name.

021114_2308_DrillYourWa6

Drilling Across

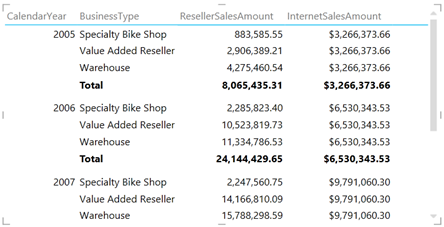
Drilling across allows us to analyze data across multiple fact tables at the same level of granularity assuming there are common (conformed) dimensions that join the fact tables. As a result, we can create a consolidated report that shows both ResellerSalesAmount from the ResellerSales table and InternetSalesAmount from the InternetSales table grouped by common subject areas, such as Date and Product. What happens if the report has to include a field that is related to only one of the fact tables? Power View will repeat the fact aggregates that are not related. For example, in the report below, InternetSalesAmount is repeated across BusinessType because this field is from the Reseller table which is not related to the InternetSales table.

021114_2308_DrillYourWa7

NOTE Drilling across fact tables could be more challenging due to the way dimension relationships work. In SSAS and Power Pivot, relationships represent inner joins. Suppose you have two tables: FactOrdersPlaced and FactOrdersShipped. Both of them are joined to a Date dimension table. Let’s say that the user drills down to a particular order in FactOrdersPlaced and wants to see the transactions in FactOrdersShipped associated with the that order. Even if you have an Order Number dimension that joins FactOrdersPlaced and FactOrdersShipped, you won’t be able to get the expected results because the date when the order was placed will probably be different than the ship date. What you really need here is an outer join between fact tables. A workaround that works across all reporting tools is to add a consolidated fact table that combines the two fact tables. Another workaround that applies only to tools that support actions, such as Excel and PerformancePoint, is to create an SSRS report that queries directly the data warehouse.

Announcing Prologika Match

Data is your biggest asset and today’s currency but the data can be messy. You know it and we’ve seen it. The messier the data, the bigger the headache. At Prologika, we believe that data quality issues should be addressed as early as possible and the validation process should start with the source systems. You need a solution to detect possible duplicated entries without ETL, custom validation code, and exhaustively hard-coded rules. This is why I’m excited to announce today the availability of Prologika Match!

Data is “dirty” because of misspellings, truncations, missing or inserted tokens, null fields, unexpected abbreviations, and other irregularities. Prologika Match uses approximate string matching (fuzzy lookup) to detect potential duplicate entries to help you improve data quality at the point of data entry. When the user attempts to save a data entry that is similar to what’s already in the database, Prologika Match can detect the issue with a certain level of confidence. Then, the source system can notify the operator about potential data duplication. As a result, the data is cleaned at the point of entry and duplicated data is avoided.

Duplicated data is a serious issue with many industries, such as healthcare or insurance. Suppose that your company sells products to individual customers. Further, suppose that there is no easy way to identify a customer. When a customer contacts your company, the operator responsible for the data entry enters the customer information in the system. However, the data operator might misspell the customer name or its address. As a result, if this issue remains undetected, the system will create a new record for that customer. However, Prologika Match is capable of detecting such duplicated entries by predicting their similarity and notifying the operator.

Sounds interesting? Give Prologika Match a try now!

Presenting at SQL Saturday Atlanta

The next Atlanta SQL Saturday will be on May 3rd. I’m doing a “Deep Dive into the Microsoft BI Semantic Model (BISM)” pre-conference session on May 2nd. You can register using this link. The organizers set up a promotion code for $10 off registration, good for the first 10 users – the code is “AtlantaBI”.

Teo Lachev: Deep Dive into the Microsoft BI Semantic Model (BISM)

SQL Saturday #285 – Atlanta

Friday, May 2, 2014 from 9:00 AM to 4:30 PM (EDT)

“The chances are that your organization has a centralized data repository, such as ODS or a data warehouse, but you might not use it to the fullest. Join this insightful full-day event to understand the importance of having a semantic layer that bridges users and data. In the Microsoft BI world, BISM consists of Power Pivot, Tabular, and Multidimensional.

We’ll start by comparing these technologies to understand their usage scenarios, strengths and shortcomings. Next, we’ll put our business user’s hats and see how Power Pivot and the rest of the Microsoft self-service BI stack helps you integrate data from multiple data sources, implement self-service BI data models with Excel to ideate and promote divergent thinking.

Next, we will follow the BI continuum and see how to share these models and reports with your teammates by deploying them to SharePoint. Business intelligence professionals will discover how to build scalable and secure organizational solutions powered by Tabular and Multidimensional that deliver supreme performance with large data volumes and promote a single version of the truth.”

I submitted also a session proposal “Real-time BI with StreamInsight” for Saturday. It’ll be a busy SQL Saturday for me.

020114_0320_Presentinga1

Divorce Your Methodology

At the Atlanta BI meeting last night, there was a question from the audience about differences between Inmon and Kimball and which methodology should be followed when implementing a data warehouse. I’ll recapture my thoughts and the feedback I shared.

As BI practitioners, most of us use methodologies and it’s easy to fall in love with a specific methodology. But sometimes methodologies conflict each other. So, don’t feel very strongly about methodologies. Instead, study them and try to synthetize their best. The best methodology is the one that delivers a business solution in the most practical and simple way. Back to Inmon vs Kimball, I have deep respect for both of them. They both contributed a lot to data warehousing that forms the backbone of modern BI. Both of these two methodologies aim to consolidate data and promote a single version of the truth. Both of them are “pure” database-focused and vendor-neutral methodologies for designing data structures. But they also differ in significant ways. This table summarizes the high level differences between the two methodologies.

InmonKimball
APPROACHTop-down
Data warehouse first, data marts later
Bottom-up
Data marts first, data warehouse later
SCHEMANormalized (3NF) schemaDenormalized (star) schema
HISTORYAll history needs to be capturedDepends on business requirements
Type 1 vs Type 2 dimensions


So, which one to follow? My answer is that there is a place for both. Consider the following BI architectural view.

012914_0241_DivorceYour1

Data comes from veriety of data sources. Some data, such as Products, Customers, Organizations, represents master data that should be ideally maintained in a separate repository, e.g. in Master Data Services. However, most of the source data is not master data and must be staged before it’s imported in the data warehouse. Instead of a transient staging database whose data is truncated with each ETL run, consider an ODS-style staging database that maintains historical changes.

Start_DateEnd_DateStoreProductDeleted_Flag
1/1/20105/1/2010AtlantaMountain Bike 1
5/2/20103/8/2012AtlantaMountain Bike 2
3/9/201212/31/9999NorcrossMountain Bike 2

The Start_Date and End_Date columns are used to record the lifespan of each record and create row new versions each time the source row is changed. The example shows three changes that a given product has undergone. This design offers two main benefits:

1.    It maintains a history of all changes that were made to all columns to all tables. Typically, OLTP systems don’t keep track of changes so the staging database can be used to record changes.

2.    It maintains a full backup of the data. If a data warehouse needs to be reloaded, its history can be recreated from the staging database.

This ODS design is effectively your Inmon methodology in practice. For the data warehouse, I’d go with Kimball dimensional modelling. Dimensional modelling is a practical design technique whose goal is to produce a simple schema that is optimized for reporting. As far as data marts, I’m not so excited about moving data in or out of the data warehouse. In most cases, the most practical approach would be to implement a single data warehouse database and extend it as more subject areas come onboard. However, large organizations might benefit from data marts. For example, a large organization might have an enterprise data warehouse but for whatever reasons (usually IT not having enough resources), it might be difficult or not practical to extend it with a new subject areas. Then, this department might spin off its own data mart, such as on a separate database server (even from a different vendor, e.g. DW on Oracle and DM on SQL Server).

Ideally, the data mart should be able to reuse some of conformant dimensions from the data warehouse instead of implementing them anew. In reality, though, the enterprise bus could remain a wishful thinking. Having been left on his own devices, that department would probably need to implement the dimensions from the data they work with. For example, if this is an HR data mart, they would probably source an Organization dimension from PeopleSoft which is where their core data might come from.

With the risk of repeating myself, I want to reemphasize the role of the semantic layer which plays a critical role in every BI architecture. If you are successful implementing an enterprise bus consisting of a data warehouse and data marts (hub and spokes architecture), the semantic layer can provide a unified view the combines these data structures. For more information about the semantic layer benefits, refer to my newsletter “Why Semantic Layer“.

Is SharePoint Overkill for BI?

As you know, Microsoft BI is tightly interwoven with Excel on the desktop and SharePoint on the server. Most complaints about SharePoint fall in two categories:

  • Complexity – SharePoint is like the ocean. The further you go, the deeper it gets. Troubleshooting is no fun. You know it and I know it.
  • Cost – Most BI features require SharePoint Server Enterprise. Besides the product cost, each user requires a client access (CAL) license (about $100 per user). With larger companies, cost quickly adds up when you roll BI to the masses. You can use the Microsoft License Advisor to estimate your investment but be sure to include additional cost for Windows and SQL servers.

So, is SharePoint overkill for BI? My answer is it depends. Let’s take a look at the graph that shows the correlation between the organization size and SharePoint features.


012414_0229_IsSharePoin1

A small organization might not need SharePoint at all. It’s likely that all BI needs of such a company will be met by SQL Server and Excel. As the company size increases, however, SharePoint might look attractive for what’s designed for. This company might decide to adopt SharePoint Foundation (freely available) for document storage and collaboration. Unfortunately, out of all Microsoft BI tools, only Reporting Services works on SharePoint Foundation (except Power View and Alerts), as explained in Microsoft Books Online.

Supported FeaturesMinimum SharePoint Edition Required
General Reporting Services report viewing and feature integration with SharePointSharePoint Foundation
Power View and AlertsSharePoint Server Enterprise

As the company continues to grow, its appetite for more BI features increases. This is the middle zone in the S curve. At this point, the company might be interested in team BI, including Power View and Power Pivot for SharePoint. At the same time, the company might not be interested in the SharePoint enterprise features but it’s out of luck. The BI features require SharePoint Enterprise. This is where it could be useful if Microsoft introduces a SharePoint BI Edition with a more attractive pricing model, such as an edition that has all BI features, doesn’t have the rest of the SharePoint enterprise features and it doesn’t require CAL licensing. SharePoint Online can mitigate some of the cost concerns but as it stands it’s limited to self-service BI (Power Pivot and Power View) only.

Moving to the upper mid-size and enterprise sector, you’re likely to be interested in more and more SharePoint enterprise features. For example, we’re currently working on a set of best practice documents for a Fortune 50 organization that’s rolling out Microsoft BI across the enterprise. They’re interested in data governance, taxonomy, retention, content approval, manageability, security, scalability, risk management, auditing, and others. You’ll be hard pressed to find such features in popular third-party BI offerings. And, one great thing about SharePoint is that it doesn’t discriminate among documents. As far as it’s concerned, a BI artifact, such as an SSRS report or Excel workbook, is just a document…all features just work. So, SharePoint Enterprise might be an attractive platform for larger companies although its CAL licensing might be difficult to swallow.

This table shows an expanded list of the Microsoft BI features but, as I mentioned, no further investigation is necessary. All BI features except general SSRS reporting requires SharePoint Enterprise.

"Bus Matrix – the Foundation of your Dimensional Data Model" Atlanta BI Presentation

Our next Atlanta Microsoft BI meeting will be on Monday, January 27th. The main presentation is “Bus Matrix – the Foundation of your Dimensional Data Model” the speaker is Bill Anton. The meeting will be sponsored by TEK Systems. I hope you can make it.

The Bus Matrix is the cornerstone of a successful Dimensional Data Modeling strategy. It serves many purposes: from communicating requirements, capabilities, and expectations with the business users down to the prioritization and delegation of tasks across the development team. Join me in this session and learn what a Bus Matrix is, why it is the single most important document in your Data Warehouse project, and what can go wrong without it. We’ll also cover several approaches for creating and maintaining the Bus Matrix.

Bill Anton is an independent consultant whose primary focus is designing and developing Data Warehouses and Business Intelligence solutions using the Microsoft BI stack. When he’s not working with clients to solve their data-related challenges, he can usually be found answering questions on the MSDN forums, attending PASS meetings, or writing blog posts over at byoBI.com.

Auto-generating SCHEMA.INI

Power Pivot (and Tabular) uses the Access Connectivity Engine (ACE) provider to import from text files. This provider was originally designed for Microsoft Access databases and it’s limited to import files no larger than 2 GB (or 4 GB with the Office cumulative update from April 2012) as explained here. The Power Pivot Table Import Wizard allows you to import from delimited files and only a subset of delimiters are available for you to choose from.

011814_0250_Autogenerat1

However, the ACE provider supports a SCHEMA.INI file that can describe other formats, such as fixed-length files, or delimited files that use other delimiters, such as a double-pipe character “||”. If a SCHEMA.INI file exists in the same folder where the source file is located, Power Pivot will use the file.

Generating the schema file can be tedious, especially if the source file has many columns. However, the ODBC Data Source Administrator tool can auto-generate the file for you.

  1. Open ODBC Data Source Administrator (32 or 64 bit) and click Add.
  2. In the Create New Data Source, select the Microsoft Text Driver.

011814_0250_Autogenerat3

  1. Click Finish. In the ODBC Text Setup, specify the folder where the source file that you want to import from is located.
  2. Click the Define Format button.
  3. The tool is capable of interfering the format by clicking the Guess button.


  1. Once you click OK, the tool generates the schema.ini file in the same folder where the source file is located.

For some obscure reason that this support article refers to, you might get an error “Failed to save table attributes of (null) into (null)” but the schema.ini file will be still generated.

Pick List in SSRS

A customer is moving from Impromptu to SSRS. One of the SSRS missing features that was very important for this customer was the Imprompu pick list that allows users to copy a list of parameter values, such as a list entered in Notepad, to the parameter prompt. For example, the user might get a list of account codes via e-mail and this list may vary from day to day. Instead of hardcoding the list in the query WHERE clause or in the parameter default values, the user wants an easy way to copy and paste the parameter values.

Actually, SSRS supports this scenario just fine and without any custom coding on your part. You just need to add a multivalued parameter of type Text and code your SQL query to use an IN clause as usual. The attached report shows how this is done. Just copy the codes below and paste in the parameter to test the report.

AR-5381

BA-8327

BE-2349

BE-2908

[View:https://prologika.com/CS/cfs-file.ashx/__key/CommunityServer.Blogs.Components.WeblogFiles/blog/2313.Pick-List.rdl:550:0]


Teo’s Best and Worst of Microsoft BI in 2013

In the spirit of the last day of 2013, I’m sipping eggnog and contemplating on BI in 2013.

BEST

  1. Microsoft leads the Gartner’s 2013 Business Intelligence Magic Quadrant.
  2. Microsoft leads the Gartner’s 2013 Data Warehouse Magic Quadrant.
  3. Power View connectivity to Multidimensional (DAXMD) released in CU4 of SQL Server 2012 SP1.
  4. SQL Server 2012 Parallel Data Warehouse appliance released with Hadoop support at very attractive pricing.
  5. Microsoft is the first vendor to offer natural queries (unfortunately only in the cloud at this point).

WORST

  1. Microsoft not doing enough to compete effectively on the presentation/visualization front against third party vendors. I’ll throw poor mobile support into this bucket too.
  2. Slow pace of BI enhancements across product groups. Example: Excel’s still lacking Power View support for Multidimensional (DAXMD was released in May).
  3. Microsoft pushing cloud BI and deciding to prioritize cloud enhancements, such as natural query, over on premises.
  4. Microsoft’s ongoing preoccupation with Tabular (it’s difficult to find a good case for it as it’s caught now in the middle between columnstore indexes and Multidimensional) and self-service BI (focus should be 80% on organizational BI and 20% on personal).
  5. Still no metadata lineage and change impact. What happened to Project Barcelona?

Happy New Year!