Tableau Prep vs. Power Query

After a few years of extensive development and beta testing, Tableau announced its data preparation tool (Tableau Prep) for “redefining your data prep experience”. Previously, Tableau relied on other vendors, such as Alteryx, for self-service data preparation. Naturally, I wanted to take it for a spin and compare it with the Microsoft Power Query (available for free in Power BI Desktop and Excel), which has been around since January 2013. Power Query was initially introduced as an Excel add-on but now it’s available in both Excel and Power BI Desktop. For those of you pressed for time, here is the gist:

CriteriaPower QueryTableau Prep
PriceFree$70/user/month for Creator bundle
IntegrationIntegrated with Power BI and ExcelStand-alone (with preview in Tableau Desktop)
Prepackaged Connectors7026
Custom ConnectorsYesNo
Row-level transformationsKeep rows, remove rows, remove duplicates, promote headers, group by, merge, append, pivot, transpose, combine filesPivot, join, union
Column-level transformsCopy, remove, duplicate, column from example, calculated column, remove, remove duplicates, remove errors, change type, rename, transform (lower, upper, trim, etc.), replace values, replace errors, split column, index column, group by, fill, pivot, move, format, extract, number column (statistics, standard, scientific, math), date and time column, R scriptFilter (formula required), group and replace, clean (upper, lower, trim, remove characters), split, rename, remove, calculated field
Interactive graphical step flowNo (static Query Dependencies diagram)Yes
ParametersYesNo
Use R for data prepYesNo
User-created tablesYesNo
Detect and expand relationships in data sourceYesNo (one data source at the time)
Functions (to centralize common logic)YesNo
Script (all transformations in one place)YesNo
Calculation languagePower Query M languageTableau calculation language
Output destinationDirectly into PBI data model, Excel sheet (Power Query in Excel only)Save as TDE, Hyper, CSV, preview in Desktop
Output optionsOne table in the model per query (typically)One output from Tableau Prep file (Tableau model can’t handle multiple tables)

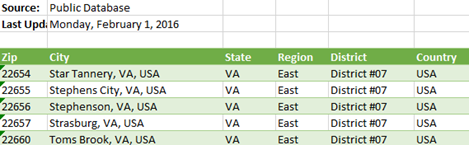
It’s clear that Tableau Prep is far behind the Power Query capabilities and has a lot of catching up to do. I took Tableau Prep for a quick ride to do simple data prep. The goal was to cleanse the geo table in the bi_dimensions Excel file that Microsoft provides as sample data for Dashboard in a Day (DIAD) workshops.

042618_2356_TableauPrep1.png

The geo table has a small (but common) issue because it has some extra rows that appear before the main dataset. These rows needs to be removed and the labels in the forth row needs to be promoted as column headers. Simple right?

042618_2356_TableauPrep2.png

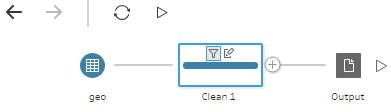
In Power Query, you can quickly filter out top or bottom rows. No formulas or functions required. There wasn’t such a feature in Tableau Prep. I had to use a column filter (requires an expression) to filter out the top three rows. So much about “a drag-and-drop visual experience” and “no scripting required”. I also couldn’t find a feature to quickly promote column headers. In my opinion, Power Query is by far more user friendly than Tableau Prep.

After enough wrangling to do what’s simple in Power Query but complicated in Tableau Prep, I wanted to save the results. In Power BI Desktop and Excel, you can conveniently load the transformed data directly into the data model. Then, to reflect the changes in the data source, such as when you get a new file with the same spec, you just refresh to re-import and transform the data. No such integration with Tableau Prep. It’s designed to run the flow manually. And to me the biggest limitation of the tool, which stems from the limitation in the Tableau modeling capabilities, is that everything falls apart when you need multiple tables in your data model. Tableau’s mentality remains “one dataset at the time”.

I’ve noticed people excited about the Tableau Prep graphical interface. While it does help visualizing the flow I’m not sure how much value it really adds given that the steps are sequential, and the tool doesn’t support conditional constraints and branches. But you have pretty icons…without much behind.

While testing the tool, I couldn’t help but ask myself “Why pay hundreds of dollars per user/per year for Tableau Creator when Power BI Desktop is better and free?”

I shared more thoughts about Tableau vs Power BI in my blogs Power BI vs. Tableau (Part 1), Power BI vs. Tableau (Part 2), Power BI vs. Tableau (Part 3), and Tableau Hyper vs. Power BI xVelocity. As usual, I welcome your comments. Tableau fans are welcome too.

Atlanta MS BI and Power BI Group Meeting on April 30th

MS BI fans, join us for the next Atlanta MS BI and Power BI Group meeting on Monday, April 30th at 6:30 PM. Patrick LeBlanc will do a deep dive into Power BI Report Server. TEKsystems will sponsor the meeting. And your humble correspondent will demo several latest Power BI features: buttons and Q&A. For more details, visit our group page and don’t forget to RSVP (use the RSVP survey on the group page) if you’re planning to attend.

Atlanta BI Group April 30th Meeting Reminder

Please RSVP to help us plan food by 2 PM on the day of the meeting by latest:

  1. Go to the Atlanta BI home page (atlantabi.pass.org).
  2. Choose Yes and submit the RSVP survey found at the right top corner of the page.

Please note that the voting system tracks votes by cookies. If you don’t see the option to submit the survey, clear your browser cookies, or right-click the Internet Explorer icon, and then click Start InPrivate Browsing. Free covered parking is available at South or North Terraces. Or, use the free open non-ticket parking next to North Terraces (coming north on Ashford Dunwoody, turn left on Perimeter Center Terrace and them immediately right). 

Presentation:Power BI Report Server: A Deep Dive
Level: Intermediate
Date:April 30, 2018
Time6:30 – 8:30 PM ET
Place:South Terraces Building (Auditorium Room)

115 Perimeter Center Place

Atlanta, GA 30346

Overview:So, you think you know everything you need to know about the Power BI Report Server because you use traditional SQL Server Reporting Services. Well, don’t believe it. In this session we are going to discuss topics such as Configuring Kerberos to resolve connectivity issues. We will discuss different authentication types, when you need them, why you need them and how to use them. We will then jump into configuring your report server to host Excel workbooks using Office Online Server. Finally, we will demonstrate how to configure an SSAS Power Pivot instance for the Excel data model. In addition to these topics, we will discuss other advanced topics such as connectivity and high availability during this demo-heavy session.
Speaker:Patrick LeBlanc is a currently a Data Platform Solutions Architect. Along with his 15+ years’ experience in IT he holds a Master of Science degree from Louisiana State University. He is the author and co-author of five SQL Server books. Prior to joining Microsoft, he was awarded Microsoft MVP award for his contributions to the community. Patrick is a regular speaker at many SQL Server Conferences and Community events.
Sponsor:People are at the heart of every successful business initiative. At TEKsystems, we understand people. Every year we deploy over 80,000 IT professionals at 6,000 client sites across North America, Europe and Asia. Our deep insights into IT human capital management enable us to help our clients achieve their business goals – while optimizing their IT workforce strategies. We provide IT staffing solutions, IT talent management expertise and IT services to help our clients plan, build and run their critical business initiatives.
Prototypes with Pizza“Buttons and Q&A Explorer” by Teo Lachev


092417_1708_AtlantaMSBI1.png

Processing AAS Models Asynchronously

Analysis Services normally requires a live connection between the client and server. If the connection is interrupted, the server considers that the client has lost interest and cancels the running operation.Strictly speaking, there is  a ‘long running operations’ (LRO) protocol built over the HTTP XMLA messaging protocol which mitigates the issue of disconnects by attempting to keep alive the request/responses. This helps avoid the HTTP disconnection problem for the client libraries and improve the reliability of client applications. But in the end, your mileage will vary depending on the reliability of the networks in between the client machine and the service endpoint.

You don’t have to worry about the connection quality when you send queries as they usually execute fast. Processing, however, is a different story as it might take very long. As a reference point, a 4 billion database can take easily half a day to refresh. Babysitting processing and hoping that the client doesn’t lose the connection, or that SSMS (or whatever management client you use) doesn’t crash is not fun. Not to mention that such issues might not be immediately evident. For example, a few times when we attempted to process the afore mentioned database, SSMS either hung or crashed at the end of the processing task with errors such as “The operation has been cancelled”. You can easily waste hours and even days to restart failed processing and this can get frustrating.

Is it possible to fire and forget processing tasks? If you use Azure Analysis Services (AAS), you’re in luck.

AAS supports processing tasks asynchronously with REST APIs. The difference is that the service component (REST API) maintains the connectivity to the server – thus reducing the chances of HTTP disconnections from the external application. Microsoft has provided a RestAPISample console app to help you get started. As with any REST API invocation, you’d need to register the app in the Azure Portal so that you can authenticate successfully. Other than that, it’s simple to invoke the REST API and Microsoft has provided step-by-step instructions.

Another, although synchronous, option is to run a PowerShell script in the Azure Cloud Shell environment. You can upload the script as a file. The script can ask you to provide credentials interactively (Get-Credentials method) or you can hardcode the credentials. Here is an example of a PowerShell script that processes a specific table.

#prerequisites
#Install-Module -Name SqlServer -AllowClobber
#Install-Module -Name Azure.AnalysisServices

Import-Module SqlServer
Import-Module Azure.AnalysisServices
$ServerName = “asazure://aspaaseastus2.asazure.windows.net/prologika”
$DatabaseName = “AdventureWorks Tabular Model SQL 2012″
$TableName =”Reseller Sales”
$Credential = Get-Credential
# —or —
# $secPwd = ConvertTo-SecureString “PlainTextPassword” -AsPlainText -Force
# $Credential = New-Object System.Management.Automation.PSCredential (“username”, $secPwd)
$result = Invoke-ProcessTable -Server $ServerName -Database $DatabaseName -TableName $TableName –RefreshType Full -Credential $Credential

Of course, the PowerShell option is not immune to connection interruptions but the hope is that because you’re running it on Azure, the connection would be more stable compared to initiating it on your laptop. And you’re offloading the task to Azure so you don’t have to install or run anything locally.

042218_2150_ProcessingA1.png

Understanding AAS Synchronization

None of the Multidimensional and Tabular semantic models I’ve implemented required scaling out, but I understand that some scenarios might benefit from it, such as B2B or B2C reporting. Depends on the implementation approach, another benefit could be implementing a highly available farm. Implementing a scaled-out, on-premises SSAS farm is not easy. There are different techniques but all of them involve a compromise between availability and latency. Azure Analysis Services sought to make this easier. It’s as easy as changing a slider and AAS synchronizes everything somehow, right? Wrong. Here are the high-level notes of how AAS synchronization works:

  1. As a part of configuring synchronization, you can specify a designated processing node. If you do specify a processing node, processing takes place on that node only and the updated cache is distributed to the query nodes. If you don’t specify a processing node, one of the query nodes handles both processing and querying. The node that handles processing is referred to as a primary node.
  2. AAS synchronization is not automatic. You’re responsible to initiate the synchronization step, either manually from the Azure portal or automated by using Sync-AzureAnalysisServicesInstance from PowerShell, or using the REST API for Azure AS. This means that every time you process the model, you’d need to use one of these mechanisms to sync the model with the query nodes.
  3. When the sync command is initiated, AAS copies the entire AS database from the primary node to blob storage. That’s because the primary (read/write) node is on a different copy than the query nodes so that it can be updated without effecting end-user queries. The file copy happens inside the blob storage (no network traffic is involved). Additional details about the file copy process:
    1. Multi-threaded (unlike the SSAS sync wizard)
    2. Hydrates multiple replicas from a single data folder
    3. The data folder is striped for better I/O
  4. Once the updated database (all files) are copied to the blob storage, the query nodes detach the old copy and attach to the new one.
  5. AAS waits until the model is fully loaded into memory and available for queries before making the copy (replica) online.

How fast is the sync process? We measured with a 50 GB database and it took 20 minutes for the sync process to complete. I guess most time was spent in the last step. So, as it stands, AAS synchronization is more suitable for predictable processing windows, such as in the “classic” case where ETL processes and synchronizes the model once per day, outside working hours. It might not work well for real-time solutions, where new data might arrive throughout the day and business requirements call for minimum latency because you might not have enough time for the file copy to complete.

Another gotcha that we ran into was that there seems to be an issue with the metrics reporting and a scale-out farm. During load testing we saw that the average QPU of a two-node farm (S4 performance tier with max QPU of 400) showed saturation at 200 average QPU. It looks like the Azure portal collects 400 from each node and then divides by the number of nodes. We raised the issue to Microsoft and probably it will addressed soon.

Scaling out is not about reducing query times. It’s about handling more load when scaling up doesn’t go enough. When you scale out to a two-node farm, you’re still limited by the resource constraints (memory, CPU) of each node. Unless you are after a highly available BI solution, scaling out should be your last option. Time spent in optimizing your model design, data storage, and queries is usually much more productive than taking the easy way out and throwing more hardware (and money).

This blog explained how AAS synchronization works. I hope Microsoft will offer more options in future to make it more useful. A welcome enhancement would be the ability to configure an automatic and less granular synchronization, such as to copy only the files that have changed.

Demystifying Tabular Object Level Security (OLS)

Object-level security (OLS) is a frequently requested security feature when implementing semantic models. For example, a current project disallows some sales persons to see sensitive measures, such as Margin and Profit. In Multidimensional, modelers could use cell security to meet such requirements with the risk of compromising performance. Starting with SQL Server 2017 (compatibility level 1200), Tabular supports object-level security to disallow access to entire tables or specific columns without a performance penalty. As it stands, OLS has the following limitations (for a full list, review the documentation):

  1. There is no user interface for defining OLS. Instead, after defining your roles and row filters as you’d typically do, you need the extra step to open the model.bim source code and enter the OLS definition manually. For example, this Users role definition disallows access to the GrossProfit column. Fortunately, SSDT preserves OLS when you make changes to the role in the Role Editor and save.
    “roles”: [ {

    “name”: “Users”,

    “description”: “All allowed users to query the model”,

    “modelPermission”: “read”,

    “tablePermissions”: [

    {

    “name”: “Reseller Sales”,

    “columnPermissions”: [

    {

    “name”: “Gross Profit”,

    “metadataPermission”: “none”

    }] }

    ] }

  2. Unlike Multidimensional cell security, Tabular OLS doesn’t support specifying additional or different conditions that apply to OLS only within the same role. For example, you can’t have a single role that applies one condition (row filter) for data-level security and another condition for object-level security. In other words, OLS inherits the row filters defined in the role. Because of these limitations, security requirements might force you to create multiple roles, such as a Sales RLS role for sales people who can see all columns, and “Sales OLS” role for sales people that are disallowed access to some columns even if the same row filters apply.
  3. OLS enforces access to physical columns only. You can’t secure measures directly. If you need to secure a measure, you need to secure a base column that the measure uses either directly or indirectly.
  4. There is a current bug that we ran into regarding drillthrough and OLS. If a user belongs to a role that defines OLS and the user drills through any column in the secured table, Tabular generates this error:

The ‘<sensitivecolumnname>’ column cannot be found in the ‘$<tablename>’ table.

Microsoft has promised a fix in the next cumulative update. UPDATE 4/24/2018 – This issue was fixed in CU6 of SQL Server 2017.

Use Tabular object-level security to protect sensitive columns or exclude entire tables. Coupled with row-level security (RLS), OLS allows you to implement both data and metadata restrictions, subject to the limitations I discussed in this blog.

Another Successful Power BI Workshop

Thank you to everyone attending the Power BI workshop by Prologika yesterday. We had great turnout with more than 50 people from 30 companies attending the event at the Microsoft Technology Center in Alpharetta! The key takeaways were:

  • Many companies transition to Power BI because of its great value-to-cost proposition.
  • PowerQuery is a fantastic tool for data cleansing and transformation that is missing in other competitor offerings.
  • Power BI can deliver rich visualization capabilities that delight end users and surpass by far the capabilities of traditional reporting tools.
  • Instead of being a just a stand-alone BI tool, Power BI is a part of a rich ecosystem of products and services that allows you to extend Power BI in versatile ways.

Notes on Analysis Services Tabular Performance and Parallelism (Part 2)

In my “Notes on Analysis Services Performance and Parallelism” blog, I shared limited performance results about scaling up Azure Analysis Services Tabular. As I mentioned, I expect the same findings to apply to SQL Server Analysis Services Tabular for on-premises deployments. As the official load test results came in, I’m ready to provide more info and general recommendations. We load tested the AAS semantic model mentioned in the previous blog (about 2 billion rows) by capturing a representative subset of DAX queries including slow, medium and fast queries. We used a stepped load starting with one user and increased the number of concurrent users with one every 30 seconds. We considered the server saturated when 90% of maximum QPU was reached on average. For example, the S4 performance level has 400 QPU (20 cores) so the saturation level would be 360 QPU on average.

Note It takes a while for the Azure portal to refresh the graphs with metrics, with 30 seconds or more lag time being the norm. Also, you’ll probably find that one test controller is sufficient to saturate Tabular. Also, don’t focus too much on the number of concurrent users alone. In real life, you might not even have two concurrent users (user executing queries at the same time) but you might have a dashboard that runs queries in parallel, such as in the case of a Power BI report with multiple visuals. It all depends on what performance goal you’ve established prior to running the test. You established a performance goal right? If you don’t know how, my “Can Your BI Solution Scale” presentation should help. I personally prefer to express the goal as queries/sec instead of concurrent users as it’s very difficult to determine concurrency.

The results were consistent with my previous observations. As you can see in the chart below, in this case scaling up to a higher price tier increases the system throughput almost linearly.

S2 (200 QPU)S4 (400 QPU)S9 (640 QPU)
Number of cores102032
Max concurrent users4812
90% QPU capacity reached in time from test start2 min3.5 min6

To recap, scaling up Tabular would benefit two primary scenarios:

  1. When queries are storage engine bound – This would typically happen with larger models when significant time is spent scanning RAM.
  2. High concurrency – As you scale up and the number of cores increase, the system throughput will increase as well. Remember that you max out the highest tier (s9), you can easily scale out AAS as well, giving you the ability to scale almost linearly.

The scenarios that I don’t expect to benefit from scaling up fall into two general categories:

  1. Smaller models – Remember that Tabular allocates one core per a segment (the default segment size is 8 million rows). So, if you have a model of 100 million rows, the S2 level of parallelism (10 cores) might be good enough already. In this case, increasing the parallelism won’t help as the model just doesn’t have enough data to scan in parallel.
  2. Complex queries – Because formula engine is single threaded, formula-engine bound queries would be poor candidates for scaling up.

Plan for a load testing effort when in doubt if your semantic model would scale  Every model is different so take the above notes as general guidelines. Before scaling up, if possible, consider an alternative design to reduce number of rows and column data size and cardinality (if the queries are storage engine-bound), or optimize DAX queries relentlessly (if queries are formula engine-bound). Needless to say, fast storage doesn’t justify or compensate for a bad design or inefficient queries.

Notes on Analysis Services Performance and Parallelism

As a part of a semantic model assessment, I got to experiment with different configurations of Azure Analysis Services. In this case, the largest fact table has almost 2 billion rows so it’s a good size model. I was particularly interested the correlation between a higher performance tier and query performance. One thing that I like about PaaS is that it’s easy to change and experiment with different configurations. The thing that I don’t like is that I can’t peek under the hood. This is probably done on purpose to keep people like me out, just like these green nets surrounding construction zones. So, I don’t know what hardware AAS is running on and how it’s configured. And I failed to get clarification from Microsoft. So, I might be out of line here, but I thought my findings are worth sharing albeit not officially vetted.

AAS Basic and Standard tiers are advertised as dedicated tiers running on dedicated virtual machines preconfigured with a certain number of cores that are a 20x multiple of the tier QPUs. For example, S2 tier (200 QPUs) comes with 10 cores while S9 (640 QPUs) comes with 32 cores. If you examine the advanced properties of the AAS instance in SSMS, you’ll see Group Affinity masks that confirms this. For example, the mask for S2 is x3FF (or xFFC) which converted to binary is 1111111111, whereas the mask for S9 is FFFFFFFFFFFF for 32 1’s. I don’t know why masks are used given that the VM has already a predefined number of cores. One, and most probable, explanation is that Microsoft co-hosts multiple Analysis Services instances on the same VM. When you provision a new AAS instance, Azure finds a VM that has enough capacity and spins the new service there. If you upgrade AAS, it could get relocated to a different VM if the old one doesn’t have enough capacity. Or, Microsoft might allocates more cores to the VM and a subset to AAS.

Anyone who’s done parallel programming knows that it’s not easy. Safe access and locks need to be used to synchronize access and protect shared resources. The AS xVelocity engine (aka Vertipaq) is a multi-threaded application that accesses RAM as a shared resource. As each thread competes for a global lock for memory allocation/deallocation, scalability decreases. Because processor cores reserve memory in chunks, called cache lines, additional synchronization is required when threads access memory location that are close to each other. Before SQL Server 2016 SP1, this was a serious issue with Tabular. As we’ve learned, starting with SQL Server 2016 SP1, Microsoft switched to using the Intel Threading Building Clocks (TBB) C++ library. Specifically, Tabular now uses the TBB scalable memory allocator. Mind you that TBB is not a CPU-specific extension so any modern Intel CPU should get these benefits. “Analysis Services SP1 uses an Intel TBB-based scalable allocator that provides separate memory pools for every core. As the number of cores increases, the system can scale almost linearly” and “The Intel TBB-based scalable allocator is also expected to help mitigate performance problems due to heap fragmentation that have been shown to occur with the Windows Heap”. Further, starting with SP1, Tabular is NUMA aware with 4-node NUMA system but I don’t know if the AAS VMs are preconfigured for NUMA.

These changes seem to be very beneficial and I do see the promised linear scalability (or close to it) as the number of cores increase. After all, how would you explain a customer that the query times remain the same when they switch to a higher tier? I used this query as a sample query to measure the memory scan performance (the filter is used to prevent Tabular short-circuiting the count by using internal statistics):

EVALUATE CALCULATETABLE (ROW ( “result”, DISTINCTCOUNT ( ‘Table'[day_id] ) ),    ‘Table'[day_id] > 0)

The day_id column has a 2.5 GB of total column size with 875 distinct values. The query execution time decreased 2.5 times when switching from S2 to S9, while the storage engine scan time decreased 3 times. Of course, more complicated queries would carry additional overhead in the formula engine which as we know is single threaded.

AAS TierStorage Engine
Parallelism
Storage Engine Time (ms)Total Execution Time
(ms)
S2 (200 QPUs)9x1,5631,922
S9 (640 QPUs)29x516812

Tabular does an excellent job parallelizing the storage engine queries and maxing out all available cores in short bursts of time. Staring with SQL Server 2016 SP1, you should see substantial performance gains as the number of cores increase if the query is storage engine bound (which it will probably be with larger models).

I plan to update this blog when results from official load testing we plan to do with this semantic model are available.