Atlanta MS BI and Power BI Group Meeting on October 30

MS BI fans, join us for the next Atlanta MS BI and Power BI Group meeting on October 30th, Tuesday at 6:30 PM at the Microsoft office in Alpharetta. Neal Waterstreet will tackle the important and pervasive issue of bad data quality. ZAP BI will sponsor the event. And your humble correspondent will introduce you to Power BI Home and data profiling. For more details, visit our group page and don’t forget to RSVP (use the RSVP survey on the main page) if you’re planning to attend.

Presentation:Data Quality – Plain and Simple
Date:October 30, 2018, Tuesday
Time6:30 – 8:30 PM ET
Place:Microsoft Office (Alpharetta)

8000 Avalon Boulevard Suite 900
Alpharetta, GA 30009


Overview:Data quality is a subject that comes up repeatedly in many organizations. Most executives are concerned about the quality of the information used in their decisions. We talk about “good data” and “bad data” but what do those terms mean? In this presentation, we will first define what data quality is and look at how to measure it with data quality dimensions. Then, we’ll explore common causes for data quality issues and how to perform a data quality assessment. Finally, we’ll review the results and discuss some strategies and tools that can help improve the quality of the data in your organization.
Speaker:Neal Waterstreet is a BI Architect/Consultant with Prologika (https://prologika.com) ad he has more than 20 years of industry experience. Neal is skilled in the entire BI spectrum, including dimensional modeling, ETL design and development using Integration Services (SSIS), designing and developing multidimensional cubes and Tabular models using Analysis Services (SSAS) and Master Data Management using Microsoft Data Services (MDS). He’s also involved with the database community with the Atlanta BI and Power BI User Group and the Atlanta Modern Excel User Group.
Sponsor:ZAP’s mission is clear: to connect your business with data. Game-changing insight that impacts business performance only happens when you analyze data by business process or team objective, as opposed to by file type or IT system. This is what ZAP enables. https://www.zapbi.com/
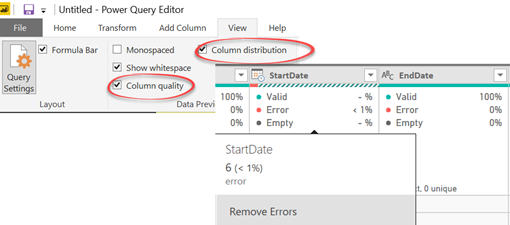
Prototypes with Pizza“Power BI Home and data profiling” by Teo Lachev


092417_1708_AtlantaMSBI1.png

Power BI Release Notes

Want to know what Power BI features are in the works and when they will be released? My “Power BI Features Report” showed you how to find what features were released over time so it’s retrospective. On the other hand, Business Applications Release Notes are forward looking. For example, the October release notes for BI go all the way to March 2019. The release notes are for all business apps (not just Power BI): Dynamics, BI, PowerApps, Flow, AI, and others. There is also a change log.

Taking the Most Out of Linked Servers

What’s the first thing that comes to mind when you hear “linked server”? Performance issues or a snail image, right? Many developers don’t like linked servers because they are “slow” although they rarely bother to investigate the underling issue, much less to fix it.

Linked servers are a very useful and commonly used feature of SQL Server. They allow SQL Server to query external data sources, such as Oracle and DB2, and to present these data sources as SQL Servers to upstream systems. A query that involves a linked server is called a distributed query. The most common issue with a distributed query is that it doesn’t “remote”. In other words, while you expect the entire query (or parts of it) to be executed on the remote server, SQL Server downloads the data locally and then performs filters or joins. This could be very expensive with large tables,  hence the DQ notoriety. Conor Cunningham (Partner Software Architect, SQL Server Engine at Microsoft) covered this topic very well in his “Distributed Query Deep Dive” presentation a while back. I just want to add a few tips and tricks harvested from a recent project.

ETL developers typically implement incremental extraction to reduce data movement between systems. It’s a best practice. For example, when loading sales transactions, the query might ask for data since the last date the data was captured in the data warehouse. Here is what the distributed query might look like (note that 4-part reference notation):

select <columns> from [<linkedserver>].[<database>].[<schema>].[<table>] WHERE InvoiceDate>=‘2018-10-20’

Unfortunately, as simple this query is, it won’t remote as you can witness by the performance degradation and the query plan (the screenshot below uses Live Statistics):

Starting from right to left, we can see that the remote query fetches all rows from the target table before it applies the filter. In fact, unless you tweak the linked server properties, this query won’t remote if it filters on any type of column, not just date. However, you might be able to get a query with filters on other data types (except date) to remote if you set Collation Compatible to True on the linked server properties in SSMS, assuming of course that SQL Server and remote server use the same collation.

EXEC master.dbo.sp_serveroption @server=N'<linkedserver’, @optname=N’collation compatible’, @optvalue=N’true’

What’s so special about dates that prevents SQL Server from remoting them? Historically, date remoting was not done because of potential issues like different time zones and clock skews between the two servers. Unfortunately, SQL Server doesn’t give the developer the latitude to ignore such issues and force a distributed query to remote (I’ve tried many permutations of passing the date parameter with no luck). You can check the OLE DB Provider properties by enabling the OLEDB Provider Information event in the SQL Server Profiler to see if the provider implements SQLPROP_DATELITERALS. In my case, both the Oracle OLE DB Provider and Microsoft OLEDB Provider for DB2 didn’t implement this feature and I discovered this by the following property in the event results:

<DateLiteralsSupport>0</DateLiteralsSupport>

So, the only way to remote the query was to convert it from a distributed query to a pass-through the query either using OPENQUERY or EXEC AT.

select <column list> FROM OPENQUERY(<linkedserver>‘SELECT * from <database>.<schema>.<table> where INVDT >= ”2018-10-20”’)

EXEC (‘SELECT TOP 10 * FROM <database>.<schema>.<table> where INVDT >=?‘, ‘2018-10-20’) AT <linked server>

The advantage of the EXEC AT method is that the query can be more than 8,000 characters and you don’t have to concatenate parameters. This method requires that you first set the RPC and ‘RPC Out” properties of the linked server to True.

exec sp_serveroption @server='<linkedserver>’, @optname=’rpc’, @optvalue=’true’

exec sp_serveroption @server='<linkedserver>’, @optname=’rpc out’, @optvalue=’true’

This blog discussed some reasons why SQL Server might not remote even simple distributed queries. I recommended Microsoft make linked servers more flexible to support such common scenarios. It will be interesting to see how the forthcoming SQL Server 2019 external tables that use PolyBase will play out. They are expected to be more optimized for throughput than for OLTP operations. So, for OLAP queries we may get better performance in comparison with linked servers.

Power BI Data Profiling

You know it and I know it. Data quality is a BIG problem that reduces the business value of BI. ETL practitioners will probably recall that SSIS includes a comprehensive Data Profiling Task but it is somewhat difficult to set up, especially if you wanted to profile multiple tables. It saves the results in an xml file and then you could use the Data Profile Viewer to visualize the results.

101618_0209_PowerBIData1.gif

Can we do something like this in Power BI? Starting with Power BI Desktop (October 2018) release you can. Well, sort of. Once you enable the column profiling preview feature, open the query behind any table and enable these options in the View ribbon.

101618_0209_PowerBIData2.png

You’ll get basic statistics showing the percentages of Valid, Error, and Empty values out of the sample size (the first 1,000 values). Here are definitions of these categories:

  • Valid – Non-Error and Non-Empty values out of the sample size
  • Error – Values with errors
  • Empty – Empty values

Below you get a column chart (not shown in the screenshot) that shows the distribution of the sample size, but unfortunately it doesn’t show the actual values. That’s all data profiling you get for now. Here is what it will take to make Power BI data profiling a killer feature:

  1. Allow data profiling over all the values (understandably there will be performance impact).
  2. Add more aggregates, such as Min/Max/Std/Median.
  3. The ability to dynamically filter the preview data for the selected bar in the profile.

Kudos to Tabular Editor!

What tool do you use for Analysis Services Tabular development? SSDT right, what else? Here is a little secret. I almost don’t use SSDT anymore, except for limited tasks, such as importing new tables and visualizing relationships. I switched to a great community tool – Tabular Editor and you should too if you’re frustrated with the SSDT Tabular Designer. Back in 2012 Microsoft ported the Power Pivot designer to SSDT to let BI practitioners implement Tabular models. This is why you still get weird errors that Excel has encountered some error. Microsoft haven’t made any “professional” optimizations despite all the attention that Tabular gets. As a result, developers face:

  • Performance issues – As your model grows in complexity, it gets progressively slower for even simple changes, such as renaming columns. The problem of course is that any change results in a commit operation to the workspace database. SSDT requires a workspace database for the Data View but it slows down all tasks even if it doesn’t have data. While the data view is useful for data analysts, I’d personally rather sacrifice it to gain development speed.
  • The horrible measure grid – Enough said. To Microsoft credit, the Tabular Explorer helps somewhat but it still doesn’t support the equivalent of the SSAS MD script editor.
  • No automation for repetitive tasks – It’s not unusual to create many measure variants, such as YTD, QTD. SSDT doesn’t help much automating them.

Tabular Editor to the rescue! It will probably take you some time to get used to it and as the author, Daniel Otykier, admits “…the tool is probably not well-suited for first time Tabular developers”. But once you get used to it you probably won’t go back to SSDT. No more workspace databases and lightning fast performance! And the cherry on top of the pie is that you can write scripts to automate repetitive tasks. Say for example, you have a bunch of base numeric columns you want to convert to explicit measures to make Excel happy (don’t get me started on the Excel support for Tabular). What is a developer to do? Write some code of course. With some C# knowledge, you whip out the following script:

Selected.Columns.ForEach( c => {

var myM = Selected.Table.AddMeasure(c.Name.Substring(0, c.Name.Length-5),

String.Format(“SUM(‘{0}'[{1}])”, Selected.Table.Name, c.Name));

myM.FormatString = @”#,##0″;

}

);

This script enumerates through the selected columns and create a measure for each column that sums the underlying column. For example, if the base column is Sales Amount Base in table Reseller Sales, the script will create a measure Sales Amount = SUM(‘Reseller Sales'[Sales Amount]). Then, you can save the script as a custom action (not be confused with AS actions). Then, select all the “base” columns, invoke the custom action and voila! – you get all the measures autogenerated! You can then select all these measures and change their properties, such as assign them all to a display folder. You also have much better control over deploying your changes to the server. Everything is simple with Tabular Editor.

101218_0108_KudostoTabu2.png

Tabular Editor is a great community tool that can help you implement and maintain Tabular models much faster than SSDT. I highly recommend it if you’re frustrated with the SSDT developer experience. Kudos to Daniel Otykier and the other community members who contributed to this tool.

ADF or SSIS, That Is the Question

Microsoft introduced Azure Data Factory (ADF) in 2015 to handle a specific scenario: tumbling window loads for Hadoop and other big data systems for internal MS usage. Then a need arose for a PaaS public-facing data integration platform which led to an interesting dilemma: SSIS or something else? Since SSIS wasn’t designed to scale out in the cloud, ADF rose to the challenge. I could argue that a better approach would have been migrating the SSIS design experience to the cloud to retain existing skills and make thousands of BI developers feel at home, as Microsoft did with SQL Server Database Engine and SSAS, but it’s a moot point now. So, ADF was incorrectly positioned as “SSIS for the Cloud” and unfortunately once that message made it out there was a messaging problem that Microsoft has been fighting ever since. Like Azure ML, on the glory road to the cloud things that were difficult with SSIS (installation, projects, deployment) became simple, and things that were simple became difficult. Naturally, Microsoft took a lot of criticism from the customers and community, including from your humble correspondent. ADF, or course, has nothing to do with SSIS, thus leaving many data integration practitioners with a difficult choice: should you take the risk and take the road less traveled with ADF, or continue with the tried-and-true SSIS for data integration on Azure?

To Microsoft’s credits, ADF v2 has made significant enhancements in features, usability, and maintainability. There is an also a “lift and shift” option to run SSIS inside ADF but since this architecture requires a VM, I consider it a narrow case scenario, such as when you need to extend ADF with SSIS features that it doesn’t have. Otherwise, why would you start new development with SSIS hosted under ADF, if you could provision and license the VM yourself and have full control over it?

SSIS has been evolving for 13 years (or 20 years if you count DTS), and it has a rich ecosystem of add-ons to tackle challenging data integration needs. ADF, on the other hand, has a humble 3-year history. It would probably take Microsoft another decade to get ADF where SSIS is today. Here are some limitations that you’ll probably run into:

  • ADF supports a limited set of connectors (even Excel is not on the list)
  • There is practically no extensibility, except custom activities (require .NET coding).
  • The ADF Execute Pipeline activity doesn’t support dynamic content for the pipeline name. This means that you can’t dynamically bind the activity to execute pipelines (an ADF pipeline fulfills the same role as a package in the SSIS world) from a list stored in a database table. Although this sounds trivial, it won’t let you implement a comprehensive ETL framework. An ETL framework is important from an architectural standpoint as any self-respected data integration developer would agree. For instance, our SSIS ETL framework complements the SSIS catalog with features that SSIS doesn’t have, such as declarative parallelism, restartability, actual vs target duration monitoring, logging, and others that I discussed in my “Is ETL (E)ating (T)hou (L)ive?” newsletter. Unfortunately, it’s not possible to migrate or implement such frameworks in ADF because of the above-mentioned Execute Pipeline restriction.
  • Continuing on limitations, ADF lags considerably behind SSIS in the areas of troubleshooting and monitoring. For example, if you misconfigure a previous step, you’ll get “Activity failed because an inner activity failed” during debugging with no way to troubleshoot this. This took hours to troubleshoot on a recent project! Of course, ADF is a cloud technology so I hope the momentum behind it continues and the feature gap narrows to bring ADF on a par with SSIS.

As of now, consider Azure Data Factory for pure PaaS solutions (sometimes, this is mandated by upper management and you don’t have much latitude). ADF would be also a good choice when your data integration loads need to scale, such as when you run a lot of ETL jobs that might be difficult to scale on a VM running SSIS. If you decide for ADF, simplify your data integration pipeline as much as possible. Strongly consider the ELT pattern instead of ETL (see that newsletter again if you don’t know what that means). Although all Microsoft cloud architecture diagrams prominently show ADF, my personal preference for cloud data integration projects is still SSIS on a VM with the Azure Feature Pack.

I’d love to hear your feedback.