Power BI Data Profiling
You know it and I know it. Data quality is a BIG problem that reduces the business value of BI. ETL practitioners will probably recall that SSIS includes a comprehensive Data Profiling Task but it is somewhat difficult to set up, especially if you wanted to profile multiple tables. It saves the results in an xml file and then you could use the Data Profile Viewer to visualize the results.
Can we do something like this in Power BI? Starting with Power BI Desktop (October 2018) release you can. Well, sort of. Once you enable the column profiling preview feature, open the query behind any table and enable these options in the View ribbon.
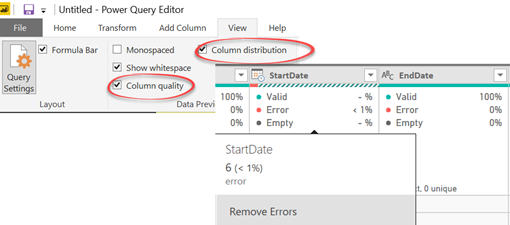
You’ll get basic statistics showing the percentages of Valid, Error, and Empty values out of the sample size (the first 1,000 values). Here are definitions of these categories:
- Valid – Non-Error and Non-Empty values out of the sample size
- Error – Values with errors
- Empty – Empty values
Below you get a column chart (not shown in the screenshot) that shows the distribution of the sample size, but unfortunately it doesn’t show the actual values. That’s all data profiling you get for now. Here is what it will take to make Power BI data profiling a killer feature:
- Allow data profiling over all the values (understandably there will be performance impact).
- Add more aggregates, such as Min/Max/Std/Median.
- The ability to dynamically filter the preview data for the selected bar in the profile.


