Implementing Asymmetric Crosstab in Power BI

A recent requirement called for an asymmetric crosstab report in Power BI. Transitioned to Adventure Works, the final report looks like this.

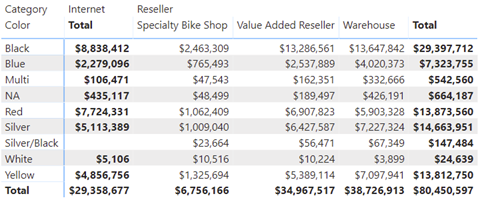
The Internet column shows the sales amount from FactInternetSales. Then, the matrix pivots on the BusinessType column in the FactResellerSales. Because, Internet sales don’t relate to BusinessType, it doesn’t make sense to pivot it. Instead, we want to show Internet sales in a single static column before the crosstab portion starts.

Implementing such a report in SSRS is easy thanks to its support of adjacent groups and static columns but not so much in Power BI. The issue is that Matrix would happily pivot both measures and the InternetSalesAmount would be repeated for each business type.

Fortunately, with some blackbelt modeling and DAX, we can achieve the desired effect. I attached the pbix file and here are the high-level implementation steps:

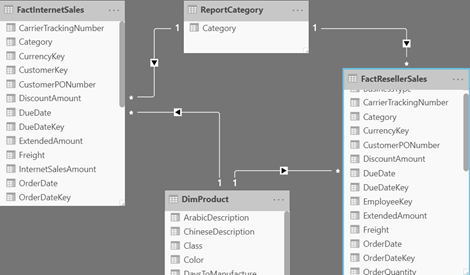
  1. Add a ReportCategory table (you can use the Enter Data feature), with a single column Category and two values: Internet and Reseller. Add a Category calculated column to FactInternetSales with a value of “Internet”. Add a Category calculated column to FactResellerSales with a value of “Reseller”. Create relationships FactInternetSales[Category]->ReportCategory and FactResellerSales[Category]->ReportCategory. These relationships are required because Matrix doesn’t support unrelated tables. Your model schema should look like this:

  2. Create a SalesAmount measure with the following formula:
     SalesAmount = IF(SELECTEDVALUE('ReportCategory'[Category]) = "Internet" && NOT ISINSCOPE('FactResellerSales'[BusinessType]),
     SUM(FactInternetSales[InternetSalesAmount]),
     SUM(FactResellerSales[ResellerSalesAmount]))

    The IF condition checks if the measure is under the Internet category. NOT ISINSCOPE(‘FactResellerSales'[BusinessType]) will return TRUE only for the total column in the Internet section. Otherwise, it will return the reseller sales. Because there are no reseller sales in the Internet category, only Internet sales will be shown. Note that SELECTEDVALUE will return FALSE for empty cells which is why I had to create the ReportCategory table.

  3. Add Matrix viz and bind Product[Color] to rows, ReportCategory[Category] and ResellerSales[BusinessType] on columns, and SalesAmount in Values. Expand the columns to the next level (to show the BusinessType level).
  4. In the Matrix format properties, go Subtotals, enable the “Per column” setting, and turn off the Category subtotal to avoid showing the reseller sales total twice.

Although Power BI has made great progress on the visualization side of things, it still lacks in flexibility. The two features that miss the most from SSRS are nesting visuals (to create repeat sections) and the flexible Matrix layout. However, with some black belt modeling and DAX, workarounds are possible.

High Memory Usage and Calculated Columns

Scenario: A client reports a memory spike during processing. They have a Tabular semantic model deployed to Azure Analysis Services. They fully process the model daily. The model normally takes less than 50 GB RAM but during processing, it spikes five times and Azure Analysis Services terminates the processing task complaining that it “reached the maximum allowable memory in our pricing tier”. Normally, fully processing the model should take about twice the memory but five times?

high_memory_usageSolution: Upon expecting the model design, I discovered that the client has decided to add (many) calculated columns to the two fact tables in the model. Most of these columns are used to calculated variances to prior year. The formulas contain DATESYTD and other DAX date-related functions. After data is read, Tabular processes calculated columns, relationships and hierarchies. In this case, the spike was due to calculations involving large time ranges and ineffective DAX expressions. Converting these columns to measures resolved the issue.

As a best practice, abstain from using calculated columns (especially in fact tables). Make sure you understand the difference between measures and calculated columns (I cover this extensively in my latest book “Applied DAX with Power BI“). If you do need expression-based columns, such to materialize expensive calculations, consider defining them upstream, such as in SQL views or Power Query.

Gateway AD Lookups

A data gateway is required for a cloud service, such as Power BI, to access on-prem data, either for live connections or for refreshing imported data. The gateway picked up an interesting feature to look up Active Directory on one property and return the value of another, which proved extremely useful for one client of mine.

Scenario: An enterprise client has adopted a hybrid architecture I set up for them, where Power BI reports connect directly to an on-prem Analysis Services Tabular model. The issue is that besides the regular network login, every user has a cloud identity (the employee number) to access cloud data sources. Before the gateway enhancement, this required explicit per-user mappings in the gateway data source. Imagine you must do this for thousands of users. and you’ll understand the maintenance issue they faced rolling Power BI across the enterprise.

Solution: Instead of explicit mappings, all they need to do now is configure the following two settings in the Microsoft.PowerBI.DataMovement.Pipeline.GatewayCore.dll.config file:

<setting name=”ADUserNameReplacementProperty” serializeAs=”String”>

<value>UserPrincipalName</value>

</setting>

<setting name=”ADUserNameLookupProperty” serializeAs=”String”>

<value>employeeNumber</value>

</setting>

When a Power BI user opens a report connected live to the on-prem Analysis Services Tabular model, the gateway receives the request mapped to the email that the user logs in Power BI. Then, the gateway queries the Active Directory to look up the user principal name (login) based on the employeeNumber which is what the Power BI login is. This query should complete fairly quickly so no worries about report queries. Make sure you restart the gateway after the configuration change.

AD lookups could save you configuring per-user mappings for live connections to on-prem data sources. Adam Saxton has a Power BI User lookup with the gateway using Active Directory video on this topic that goes into more detail.