Power BI Report Books

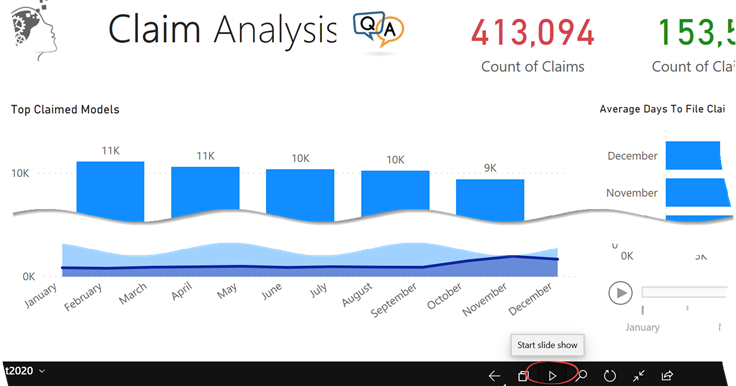
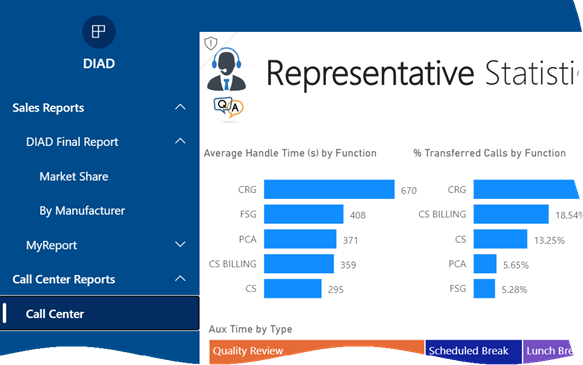
Scenario: Management has requested an easy way to view a subset of strategic reports located in different Power BI workspaces. You can ask the users to mark reports and dashboards as favorites so they can access pertinent content in the Favorites menu, but you’re looking for an easier configuration, such as to create a book of reports with a built-in navigation that organizes reports in groups (like a table of contents), such as the screenshot below demonstrates.

021520_1921_PowerBIRepo1.png

Workaround: Creating a Power BI app might be your best option. However, a long-standing limitation of apps is that there is 1:1 relationship between an app and a workspace. Therefore, by default all included content must come from the same workspace and you can’t create multiple apps in a workspace, such as to distribute content to different audiences.

But thanks to the upgraded navigation experience, an app can include links to reports in other workspaces if consumers have at least Viewer permission to these workspaces.

  1. Start by deploying the core set of reports that you want to distribute to a workspace, such as an Executive Reports workspace. This workspace will serve as a base for the app.
  2. Create an app. In the Navigation tab, the app will already include sections for each distributed report. Add links to reports in other workspaces and organize them in group.
  3. To prevent external reports “losing” the navigation experience, specify the report embed URL which you can obtain by opening the report in Power BI Service, and clicking the Embed , “Website or portal” menu. Then, copy the URL (not the iframe element) and use it as the link.
  4. Grant permission to the appropriate users or groups.
  5. (Optional) Upload an image for the app logo so end users can tell the app apart from other apps.

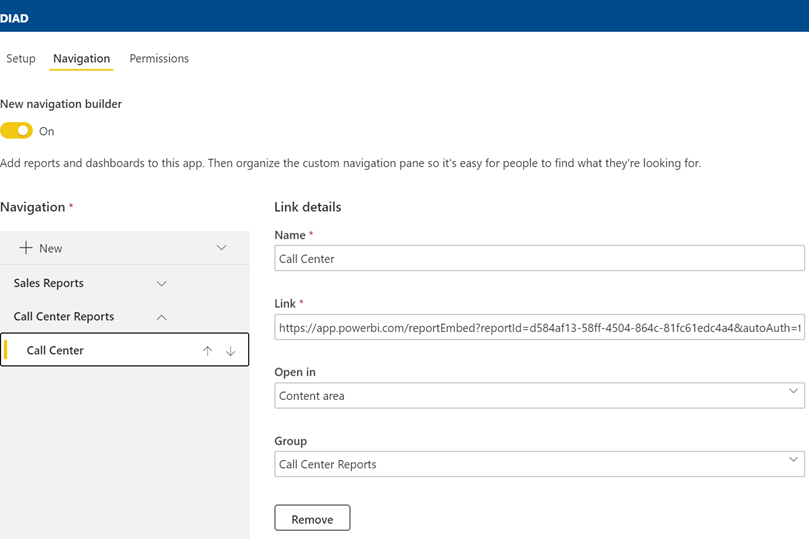
Here is a configuration for a report residing in a different workspace. Notice that to preserve the navigation experience, the report is configured to open in the page content.

021520_1921_PowerBIRepo2.png

There are two main caveats of this approach:

  1. Users must have permissions to the workspaces (except the app workspace) where the distributed reports reside. The app permissions you set up don’t propagate to content outside the app workspace.
  2. App consumers are not isolated from changes to the external reports. By default, an app propagates content changes to included content only when the app is updated. End users will see changes to external content even if the app is not updated.

Power BI Report Slide Show

Scenario: You plan to display a Power BI report on a monitor. You want the report to automatically cycle through report pages, showing each after a configurable time delay, like a photo slide show.

Solution: There are at least two solutions to accomplish this:

  1. The Microsoft-supported way is to install the Power BI Mobile for Windows and use its presentation mode feature, which is shown in the screenshot below.
  2. The open-source Chrome “Power BI Real Time Slideshow” extension.

021320_2308_PowerBIRepo1.png

Power BI Slicers and Filters

Besides the built-in cross-filtering and cross-highlighting among visuals, Power BI supports two explicit filtering options: slicers and filters. Which one to use? Traditionally, you would use a slicer when you want the user to easily see what’s filtered on the report page. But with the introduction of the new filter pane and slicer enhancements, the choice becomes more difficult. Let’s compare the two options:

CriteriaSlicerFilter
PlacementReport page (requires space on the page as other visuals)Report pane
Filter targetVisual, page, reportVisual, page, report
ConfigurationDrop-down, list, slider (numbers and dates), “buttons”Basic and advanced
TopN/BottomN filteringNoYes
Can be hiddenYesYes
Can be visible but read-only NoYes
SearchingYes (must be enabled)Yes (automatically enabled for larger lists)
Relative datesYesYes
Can be filtered by measureYesNo
Geo location filteringNoYes
Cross-filtering fields in same tableAutomatically cross-filters other slicers with fields from the same tableAutomatically cross-filters other slicers with fields from the same table
Cross-filtering fields in other tablesCan be accomplished with a filter on a measureNo
Support hierarchiesYesNo
Selecting default value programmaticallyNoOnly with Power BI Embedded JavaScript APIs
Persistent filtersYesYes
Power BI Mobile considerationsUsers find it difficult to select values in listsBetter user experience
Power BI Embedded considerationsPassing a filter via JavaScript APIs to set default values cross-filters the slicer but doesn’t pre-select the slicer default valueSets the filter as expected

A glaring gap for both filters and slicers is that you can’t currently set the default value programmatically, such as to default a date filter to the last date with data. As a workaround, you can add a field to the Date table, such as IsToday, that is set to Yes for the last date and prefilter on this field, but users must be educated to know how to remove the filter if they want to select another date. This is especially cumbersome with slicers, which don’t even support a single date selection, unless configured as a drop-down or Before/After.

Based on experience, people tend to rely mostly on slicers. But because it’s not uncommon to create reports that must be visually appealing on desktops and mobile devices, here are some recommendations to accommodate both large and small displays.

  1. Use slicers judiciously because they take space on the report page. This could be an issue with mobile devices. Besides taking space, mobile users find it difficult to select values in slicers. I typically use slicers only for common filters, such as Date. Another scenario where slicers could be useful is when you need to visualize the items in a special way, such as a slider or to show a hierarchy of items.
  2. Use filters for the rest of the filtering needs, especially if you plan to optimize reports for mobile viewing in portrait mode and/or use Power BI Embedded to embed reports.

how-we-filter