Our group celebrates its 10 anniversary! Please join us online for the next Atlanta MS BI and Power BI Group meeting on Monday, August 3rd, at 6:30 PM. Chris Hamill from the Power BI CAT team will share techniques on creating performant reports without sacrificing design. For more details, visit our group page and don’t forget to RSVP (fill in the RSVP survey if you’re planning to attend).
As you have likely observed, a performant model with optimized DAX can suffer greatly if the front-end design is too heavy. Front end report developers are often challenged with balancing performance and the richness of user requirements. Chris Hamill from Power BI CAT team will share techniques on creating performant reports without sacrificing design.
Speaker:
Chris is a Sr. Program Manager for Microsoft’s Power BI CAT team with a primary focus on front end reporting and user experience. In his day job he spends time working with enterprise customers to help skill up report authors and guide design for high impact reporting. Check out his blog at www.alluringbi.com for tips and tricks for the Power BI Creator.
Prototypes without pizza:
Power BI latest features
https://prologika.com/wp-content/uploads/2016/01/logo.png00Prologika - Teo Lachevhttps://prologika.com/wp-content/uploads/2016/01/logo.pngPrologika - Teo Lachev2020-07-30 09:26:222021-02-17 01:01:42Atlanta MS BI and Power BI Group Meeting on August 3rd
I’ve providing advisory services to a Fortune 500 organization for a few months now. As all large organizations, they adopted Power BI Premium. However, they have provisioned only one Power BI Premium P1 node which has been showing signs for overutilization. In the process, I discovered they have purchased 40 Power BI Premium cores with 32 cores left unutilized! In other words, they used 1/5 of what they’ve been paying Microsoft as Power BI Premium fees. How did they arrive at this unfortunate situation?
A year or so ago, they used the Power BI Premium Calculator to estimate the licensing cost on their own. They plugged in 10,000 users and got a recommendation for 5 P1 nodes (or 40 cores). And that’s what they bought, assuming that they will get a cluster of five P1 nodes that would load balance the reports across nodes. When they set up Power BI Premium, they set up only one P1 capacity and all the important reports got in there. And these reports have been running just fine for a long time with thousands of users … The other 32 cores – sitting ducks.
Power BI Premium doesn’t currently load balance across nodes. Once you’ve licensed a certain number of cores, it does give you the flexibility to provision nodes of different sizes. So, with 40 licensed cores, you can set up 5 P1 nodes, or 2 P2 nodes and 1 P1 node, or one P3 node and 1 P1 node. Unfortunately, the flexibility ends there. Once you provision the capacity, the meter is running use it or not. And if you’re not using all these licensed cores, you still pay unless you manually scale down the capacity. I hope to see Power BI Premium Serverless sometimes in the future, where the service scales up and down on demand and you pay for what you really consume. This will void the decision on how much capacity and nodes you need, probably save you lots of money, and make Power BI Premium more affordable.
The moral of this story? Hire a trusted advisor and technology expert, and save a lot!
https://prologika.com/wp-content/uploads/2016/01/logo.png00Prologika - Teo Lachevhttps://prologika.com/wp-content/uploads/2016/01/logo.pngPrologika - Teo Lachev2020-07-24 17:45:102020-07-24 17:45:10Why You Need a Trusted Advisor
A client has Power BI models connected to Dynamics Online. Dynamics stores all dates in UTC instead of keeping the time offset, such as 7/14/2020 1:21:29 AM +00:00. Naturally, the users want to see dates localized to the US Eastern Time zone. Easy, right? Use the Power Query ToLocal time transformation (in the Transform ribbon, expand Time, and then click To Local) to offset with the desired number of hours. But there are a few issues with this approach:
It will work fine in Power BI Desktop (assuming you are on the Eastern Time zone because Power BI will pick your computer settings), but it won’t work when you publish the dataset to powerbi.com. The reason for this is that Microsoft sets the time zone of Azure servers to UTC irrespective of the geo location of the Power BI data center. So, when Power BI Service refreshes the dataset, it will convert dates to its local time (UTC) and the net effect is that the date remains unchanged.
You can attempt using the M DateTimeZone.SwitchZone function but for some obscure reason, casting the column data type to Date after the zone change puts the date back to UTC.
The hour offset changes depending on when the country switches to Daylight Saving Time.
When the going gets though, the developer writes some code which in this case would be a Power Query ToTimeZone query function.
# open a Power Query blank query in Advanced Query mode and paste the code. Then rename the query to ToTimeZone
let
 Source = (UTCTime, TimeOffset) =>
let
 CurrentYear = Date.Year(DateTime.FixedLocalNow()),
 DST_Start = Date.StartOfWeek(#datetimezone(CurrentYear,3,14,0,0,0,TimeOffset,0),Day.Sunday) + #duration(0,2,0,0),
 DST_End = Date.StartOfWeek(#datetimezone(CurrentYear,11,7,0,0,0,TimeOffset+1,0),Day.Sunday) + #duration(0,2,0,0),
 OffsetTime = if UTCTime >= DST_Start and UTCTime < DST_End then TimeOffset + 1 else TimeOffset,
 #"Change Time" = if UTCTime=null then null else DateTimeZone.RemoveZone(UTCTime) + #duration(0, AdjustDST, 0, 0)
in
 #"Change Time"
in
 Source
The function takes two arguments: UTCTime and TimeOffset. For each row, the source query will pass the date as of datetimezone data type. The TimeOffset is the default time offset outside Daylight Saving Time. So, for US Eastern time zone, the time offset will be -5. Notice that I don’t specify types for the arguments because you may have empty (null) dates. If null is passed to UTCTime, you’ll get a runtime error. Instead, the last line checks if the incoming date is null. The function adjusts the time offset during Daylight Saving Time. Finally, it removes the time zone from the original date, so we get the date in a datetime format and then adds the offset. So, 7/14/2020 1:21:29 AM +00:00 will become 7/13/2020 9:21:29 PM.
Once the ToTimeZone function is ready, we can call it from the source query, like so:
let
 Source = OData.Feed("https://<tenant>.crm.dynamics.com/api/data/v9.1/appointments ", null, [Implementation="2.0"]),
 ToLocalTimeZone = Table.TransformColumns(Source, {{"createdon", each ToTimeZone(_, -5)}, {"scheduledstart", each ToTimeZone(_, -5)}}),
 #"Changed Type" = Table.TransformColumnTypes(ToLocalTimeZone,{{"createdon", type date}})
in
 #"Changed Type"
Notice that I use the TransformColumn transformation so that I can convert multiple date columns in one line and don’t end up with additional custom columns. In other words, I’m updating the date columns in place. Finally, I change the data type to date so that I can join to a Date dimension.
You can easily extend this code to handle times in multiple time zones, such as to report the time depending on the geo location of the user who entered the data. This will require storing the user time zone, such as in the Dynamics systemusers table.
https://prologika.com/wp-content/uploads/2016/01/logo.png00Prologika - Teo Lachevhttps://prologika.com/wp-content/uploads/2016/01/logo.pngPrologika - Teo Lachev2020-07-16 16:53:382020-07-16 17:29:09Conquering Time Zones
In my previous post about responsive reports, I said that changes to the report design can dramatically reduce the report load time. But you will undoubtedly reach a point where you cannot optimize the report any further. After all, having a page with a single visual might be fast, but I doubt it would deliver much business value. What else can be done to speed up the reports and ideally achieve a page load time of a few seconds? Our next stop for that project is to revisit the solution architecture. The client initially opted for a hybrid architecture where the reports use live connection to on-prem SSAS Tabular models. However, a significant time was spent in Power BI showing “loading data” before rendering the report. What took so long?
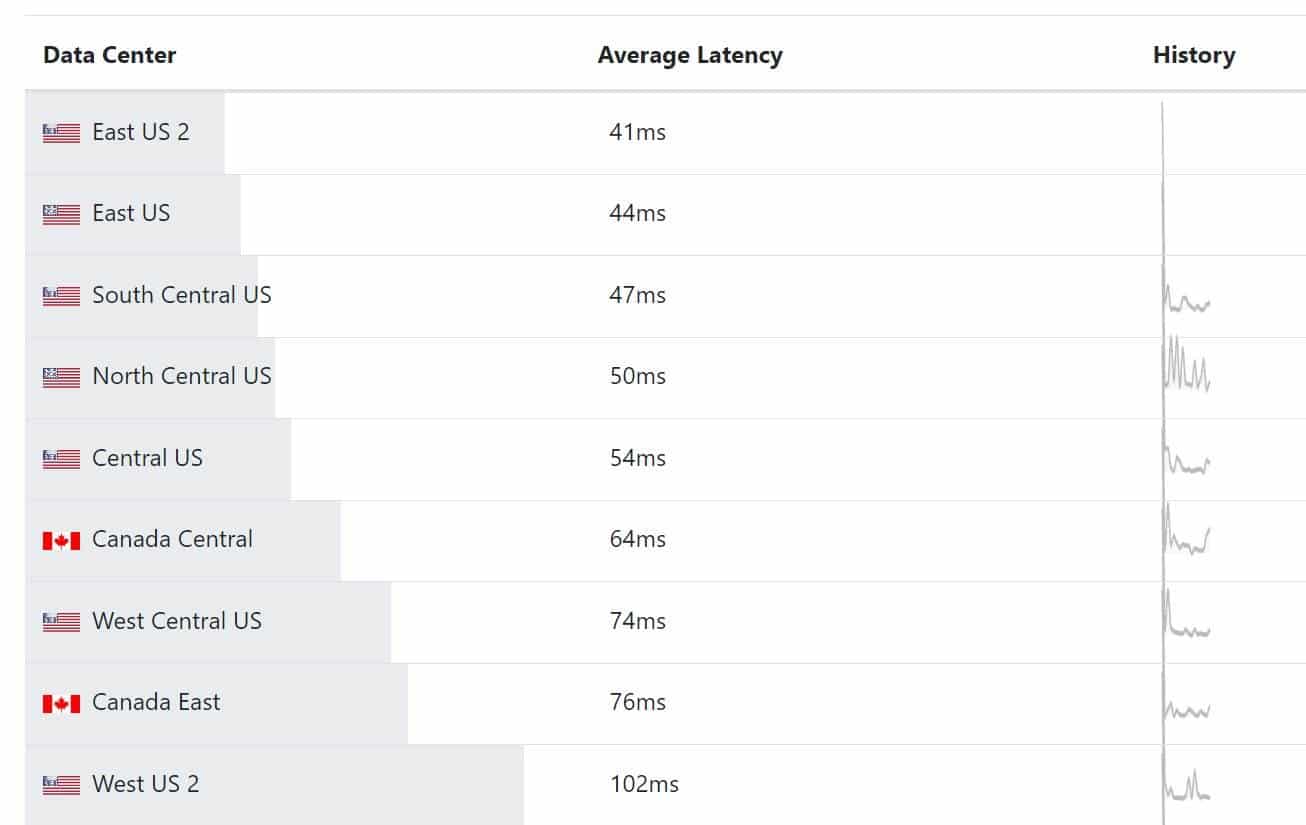
In this case, Power BI was hosted in the Azure West region, the Tabular server in the company data center in Atlanta, and most users were in the East region. This resulted in round trips crossing the country for each visual.
A user in the East region requests a report which is hosted in the West region.
Each visual generates a query which is sent to Tabular in the company data center.
SSAS returns data back to the West region.
Report payload is sent to the user in the East region.
Ideally, users, reports, and data should be in the same region. However, a long-standing limitation of Power BI is that once the first user signs up for Power BI, Power BI determines the data region based the user location and you can’t move it unless you open a support ticket with Microsoft. Power BI Premium will let you create premium capacities in a different region, but by default these capacities will be created in the original Power BI region and you can’t change the region once the capacity is created either. The chart below shows the round-trip latency doubles if the user is in the East region, but Power BI is in the West.
We decided to move the semantic model to Power BI so that Power BI owns the data. Besides potentially improving the report load time, this architecture has also other important advantages (to learn more, read my “Power BI Large Datasets: The Good, the Bad, and the Ugly” post). If you’re not on Power BI Premium, that “movement” might not easy if you have opted to use Visual Studio or Tabular Editor for development. That’s because Power BI Pro doesn’t expose the XMLA endpoint, so your only option is to migrate the model to Power BI Desktop. But migrating an SSAS Tabular project to Power BI Desktop is not officially supported and there is no automatic migration path.
Thanks to the enhanced dataset metadata (a better name would have been “metadata done right this time”), you could opt for cracking the Power BI Desktop file and replacing the model schema (my “Power BI Source Control” blog has the steps to get to the schema). You might get lucky especially if your Tabular project uses structured data source (the only data source type supported by Power BI Desktop). However, if it uses legacy data sources, you must change every table to use a structured data source and making changes to the JSON schema by hand and Power BI Desktop refusing the load the model with every typo is no fun.
On the other hand, Power BI Premium lets you deploy the SSAS model to the workspace XMLA endpoint. The prerequisites are:
Upgrade the Tabular model in Visual Studio to 1500 compatibility mode. This adds special annotations to the data source. If you don’t upgrade to 1500, you’ll find that you won’t be able to schedule the dataset for refresh as Power BI Service won’t show any connections.
Enable the XMLA endpoint for read-write in the capacity settings.
Enable the “Export data” tenant setting in Power BI (to learn more about this setting, read my “A False Sense of Security” blog).
Like the “Export data” battle wasn’t enough, we found that we have to beg the Security group to enable also the “Analyze in Excel with on-premise datasets” tenant setting. I have no idea what this setting has to do with the XMLA endpoint. Luckily, Fidler showed us the exact error message that this setting must be enabled.
Moving the semantic model paid big dividends. We could only see “loading data” for a moment. We also found that the network speed of the user connection and the browser play a significant role. For best performance, users should use Chrome or new Edge and have a broadband connection. We were able to reduce further the load time of the first page by enabling the published dataset for query caching which is only available in Power BI Premium.
https://prologika.com/wp-content/uploads/2016/01/logo.png00Prologika - Teo Lachevhttps://prologika.com/wp-content/uploads/2016/01/logo.pngPrologika - Teo Lachev2020-07-06 14:57:282020-07-06 14:57:28Designing Responsive Power BI Reports (Part 2)
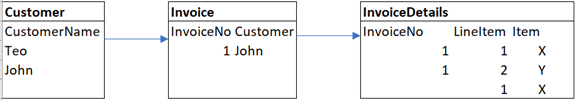
Consider the following three tables. Notice that InvoiceDetails has a data integrity issue where the third row doesn’t have InvoiceNo (InvoiceNo is blank).
What would a measure with COUNTROWS(Invoice) return for Teo? BLANK(), right? And that’s correct because Teo has no invoices. Now, what would COUNTROWS(InvoiceDetails) return for Teo? BLANK() again given that Teo has no line items? Nope, it returns 1. In other words, it will return the count of all line items whose InvoiceNo is blank. How come?
COUNTROWS(Invoice) returns blank for all customers with no matching rows in Invoice because these customers are mapped to the blank row in Invoice, which is excluded from COUNTROWS by default. But if you change COUNTROWS(Invoice) to COUNTROWS(VALUES(Invoice)), then 1 will be returned for these customers. Then, the filter flows to InvoiceDetals through the blank row and counts all rows with blank InvoiceNo.
This behavior wouldn’t have happened in SQL. However, DAX blank is not SQL null. Blank sales in DAX means no sales or zero sales, but null sales in SQL means unknown sales. Therefore, in DAX blank = blank, but in SQL null is always different than null.
Thanks to the Father of DAX, Jeffrey Wang, for shedding light in dark places.
MS BI fans, please join us online for the next Atlanta MS BI and Power BI Group meeting on Monday, July 6th, at 6:30 PM. David Eldersveld, a Microsoft MVP, will demonstrate cool visualization techniques using DAX. For more details, visit our group page and don’t forget to RSVP (fill in the RSVP survey if you’re planning to attend).
Presentation:
DAX Visualization Techniques for the Power BI Table/Matrix
Did you know that DAX is more than a modeling language and can also be used for data visualization? From sparklines to bullet charts, Unicode text to SVG, icons to maps; learn different techniques to build visuals within visuals using DAX. In this session, David Eldersveld guides you through techniques that go beyond basic conditional formatting to enhance your table and matrix visuals.
Speaker:
David is a Solution Architect and Microsoft MVP who has employed skills in technology development, data integration, data analysis, and Microsoft BI for over ten years. David enjoys building BI and analytics solutions with technologies in Microsoft Azure and the Power Platform. In addition to his work with the Microsoft Data Platform at BlueGranite, he also blog at dataveld.com.
Prototypes without pizza:
Power BI latest features
https://prologika.com/wp-content/uploads/2016/01/logo.png00Prologika - Teo Lachevhttps://prologika.com/wp-content/uploads/2016/01/logo.pngPrologika - Teo Lachev2020-07-02 07:24:362021-02-17 01:02:05Atlanta MS BI and Power BI Group Meeting on July 6th