Designing Responsive Power BI Reports
I’m currently providing advisory services to an enterprise client for architecting and implementing an executive dashboard. As a typical dashboard, the UX design included various KPIs that look like these:
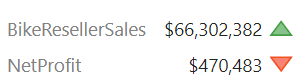
The Power BI report implementation followed the design and the above visualization was implemented as four cards and two textboxes. Including other UX elements, such as icons, labels, etc., the most important summary page of the report ended up having more than 100 visuals. It took 25 seconds to render the page on average, which is horrible performance. Performance Analyzer showed that DAX queries are very fast and most of the time was spent in the “Other” category. This means that because JavaScript is single-threaded, visual rendering is sequential. Indeed, the SQL Server Profiler revealed that out of 25 seconds, the first 15 seconds were spent elsewhere before Analysis Services Tabular starts receiving DAX queries. The Performance Analyzer document provides the essential coverage about how Power BI renders visuals, but the bottom line is this:
The more visuals the page has, the slower it will be. If you find that most of the time is spent in the “Other” category on page refresh, more than likely this is caused by Power BI serializing the visual rendering. If this is the case, the best course of action would be to reduce the number of visuals.
For example, the above visualization can be rendered with one visual only (Matrix) and some blackbelt visualization techniques. Matrix supports rendering measures on rows (in the Values section of the Format tab, turn on “Show on rows”). Spacing the rows can be achieved by increasing row padding. And icons can be rendered with conditional formatting. Another technique for reducing visuals and faster rendering is eliminating many labels with a page background image. What didn’t help was disabling visual interactions although it doesn’t hurt disabling it if you don’t need it. We’ve also found that browsers differ in how fast their render visuals. Internet Explorer was the slowest while Chrome and the new Edge were the fastest.
How fast did their report get after applying such optimizations? Between 50 and 60% faster.
True, Power BI has report design limitations. Developers with SSRS background will miss more advanced features, such as nesting visuals (e.g. bullet graph inside a matrix) and asymmetrical crosstab layouts. Still, techniques as the one I shared above will help you create more responsive reports.


