Atlanta MS BI and Power BI Group Meeting on April 6th

MS BI fans, the time has come for a virtual meeting. Please join us online for the next Atlanta MS BI and Power BI Group meeting on Monday, April 6th, at 6:30 PM. I’ll show you how business analysts can apply AutoML in Power BI Premium to create predictive models. For more details, visit our group page and don’t forget to RSVP (fill in the RSVP survey if you’re planning to attend).

Presentation:Bringing Predictive Analytics to the Business User with Power BI AutoML (Virtual Meeting)
Date:April 6th, 2020
Time6:30 – 8:30 PM ET
Place:Join Microsoft Teams Meeting

Learn more about Teams | Meeting options

Computer audio is recommended

Conference bridge number 1 605 475 4300, Access Code: 208547

Overview:With the growing demand for predictive analytics, Automated Machine Learning (AutoML) aims to simplify this process and democratize Machine Learning so business users can create their own basic predictive models. Join this presentation to learn how to apply AutoML in Power BI Premium to predict the customer probability to purchase a product. I’ll show you the end-to-end AutoML process, including:

·       Create a dataflow

·       Choose a field to predict

·       Choose a model type

·       Select input variables (features)

·       Train the model

·       Apply the model to new data

·       Bonus: Integrate Power BI with AzureML

Speaker:Through his Atlanta-based company Prologika (https://prologika.com), a Microsoft Gold Partner in Data Analytics, Teo Lachev helps organizations make sense of their most valuable asset: their data. His strategy formulation, trusted advisory and mentoring, design and implementation services empower clients to apply effectively data analytics in order to understand, improve, and transform their business processes. Teo has authored and co-authored several books on organizational and self-service data analytics, and he has been leading the Atlanta Microsoft BI and Power BI group since he founded it in 2010. Teo has been a Microsoft Most Valued Professional (MVP) Data Platform since 2004.
Prototypes without pizza:Power BI latest features

PowerBILogo

How Much Are You Really Saving?

I helped an ISV a while back with their BI model design. They purchased a data transformation tool for $5,200/year because it’s “simple to use” (the tool was designed for self-service data transformation tasks by business analysists) and “relatively inexpensive”. The idea was to run the tool manually every time they have new data, import data from text files, transform, and output the data in another set of files, and then load the transformed data in Power BI. However, as it typically happens, the data transformation complexity quickly outgrew this approach. What did the ISV learn along the way?

  1. Stage the data – Although it’s tempting to do transformations on the fly, data typically must be staged so you can query and manipulate it. This is also required to compare the input dataset with the target dataset and take care of things like Type 2 slowly changing dimensions that may sneak in unexpected.
  2. Get a relational database – At much lower price point of purchasing a “user-friendly” ETL tool that does transforms only, the ISV could have bought a scalable SQL Server Standard Edition priced at $1,859 per core (or $7,500 for four cores). Mind you that this is a perpetual license that will typically last you 2-3 years until it’s time for upgrade. And they must pay only for production use (remember that on-prem SQL Server is free for dev and test). Or, they could have opted for an Azure SQL Database and pay as they go (Microsoft gives away $120,000 as Azure Cloud credits for qualifying startups for two years). Or, if they are really under budget and don’t have large data volumes, they could have gone with the free SQL Server Express edition.
  3. Use the ELT pattern – What happens when you outgrow the capabilities of the “user-friendly” tool and you must migrate to a professional tool, like SSIS or ADF? Start over. You don’t want to do this, trust me, because more than 60% of the effort to build a BI solution typically goes into data prep. Personally, I’m a big fan of the ELT pattern (see my blog “3 Techniques to Save BI Implementation Effort” for more info on this pattern) that relies heavily on T-SQL and stored procedures. If you go ELT, the tool choice becomes irrelevant as you use it only to orchestrate data tasks. For example, you use Control Flow and very simple Data Flow (just a simple source-destination data flow to stage data) in SSIS. And as a bonus, if one day you migrate to Azure Synapse, you’ll find that it recommends ELT too. Since they wanted to run ETL occasionally, they could have used Visual Studio Community Edition and the SSIS extension. Or, they could have gone completely free by using an open-source ETL tool, like Talend.

When evaluating tools, cost is not the only factor. Your design must be flexible and capable of accommodating changes which are sure to happen.

Tracking COVID

I’ve seen various reports designed to track COVID-19. I personally like the Microsoft Bing tracker (https://www.bing.com/covid). Not only does the report track the current counts, but it also shows a trend over time. It even goes down to a county level (the trend is not available at that level)! And it’s very fast. As good as it is, this is one report I hope I don’t have to use for long… Stay healthy!

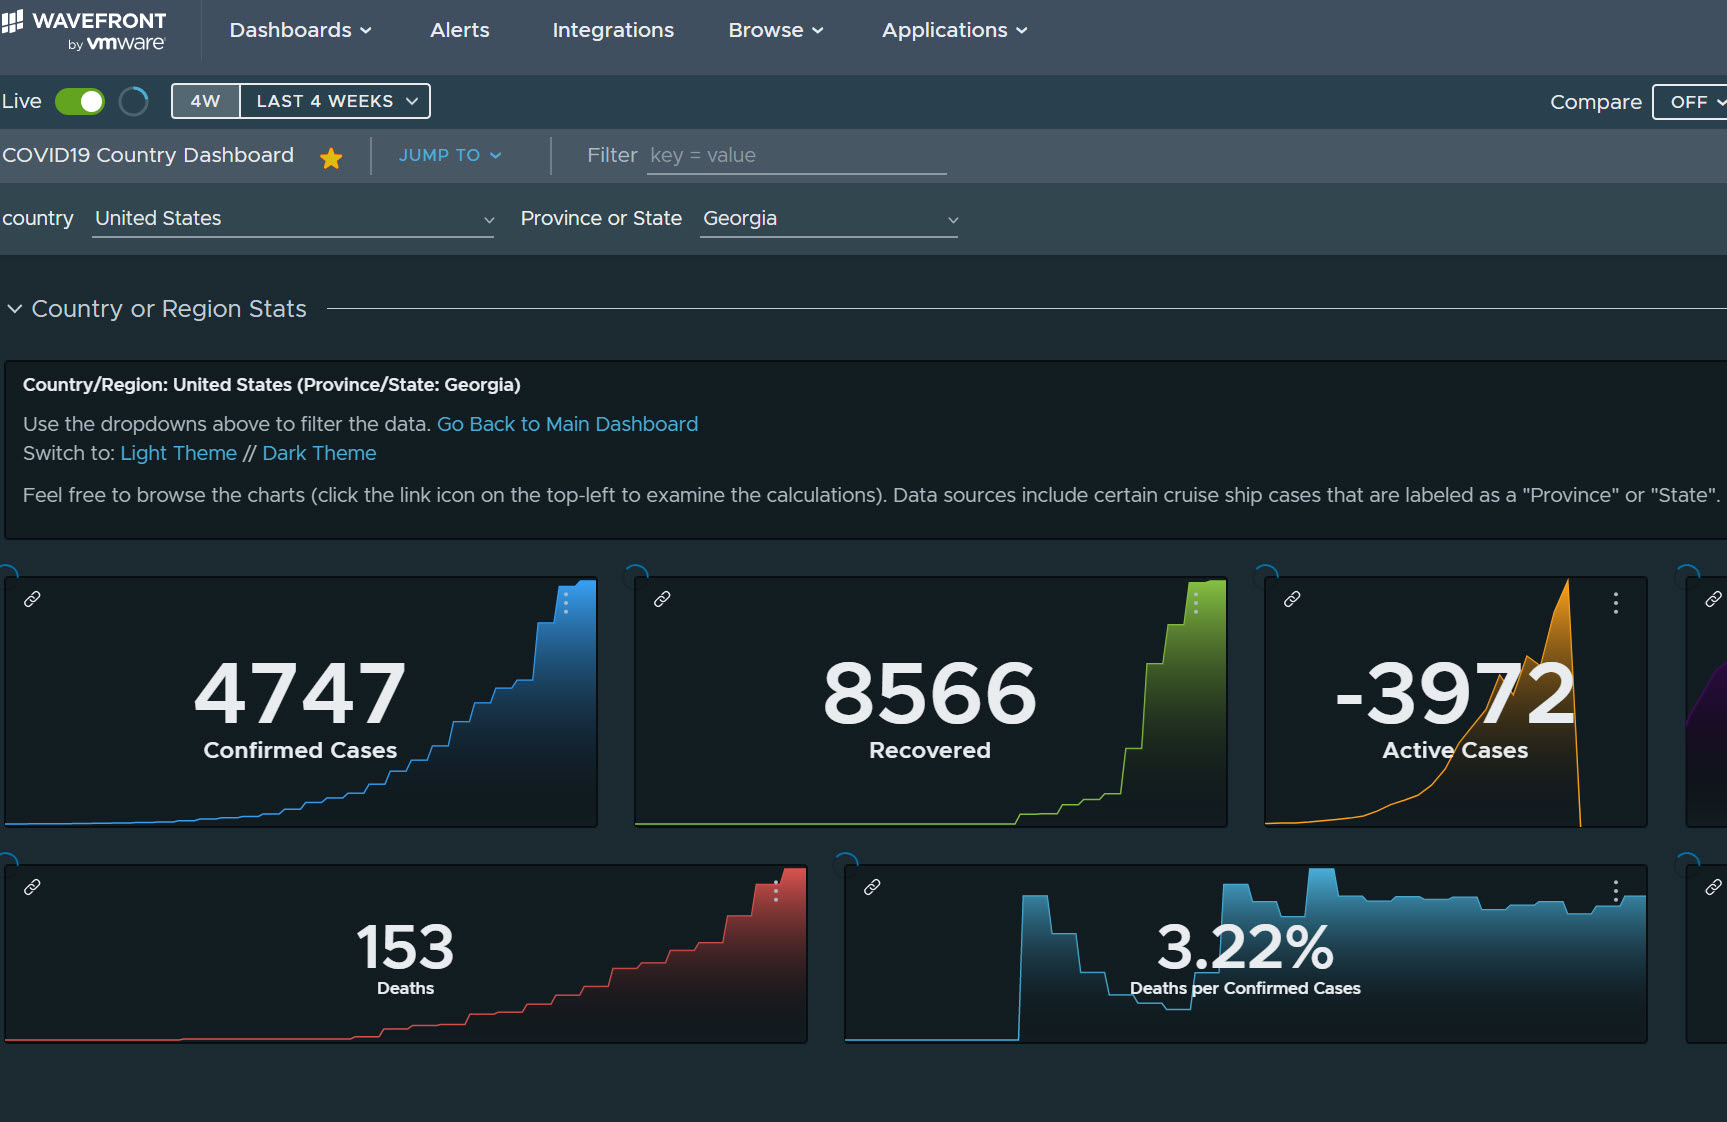
Here is another more advanced dashboard that a data geek will appreciate.

Getting to Power Apps Source Code

As it stands, Power Apps doesn’t offer an easy way to get to the app source code. Yet, there are scenarios where this could be useful, including:

  1. Putting the app source under source control when the Power Apps version history is not enough. Currently, Power Apps doesn’t integrate with source code repos, such as GitHub.
  2. Finding references to an item. For example, I’ve referenced a collection in the wrong property, and I couldn’t find what triggered the collection load on the app startup. Since Power Apps doesn’t currently include dependency analysis for collections, I wanted to search the source code to find all references to it.

Here is the fastest way to get to the app source code:

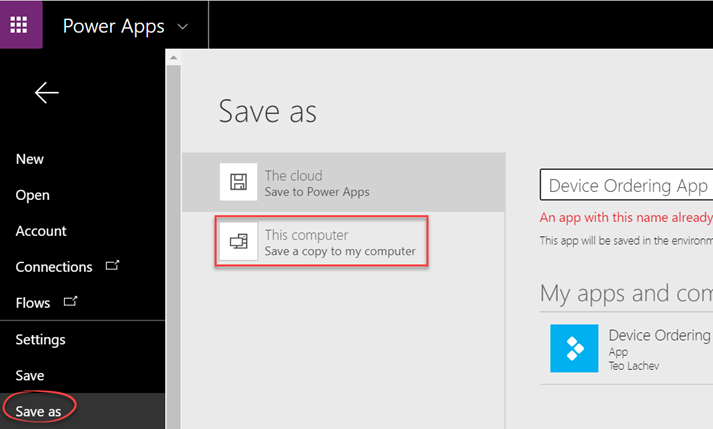
  1. Open the app in edit mode and click Save As.
  2. Choose “This computer” and click Download to download the app as a *.msapp file
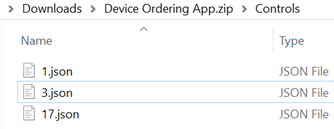
  3. Rename the extension of the downloaded file to zip. Double click the zip file.

In my case, the exported app has three *.json files in the Controls folder. The interesting code is in the largest json file: 3.json.

Open this file in your favorite JSON editor and this is how we get to the app source code.

Getting Lineage Across Power BI Tenant

Power BI Service (powerbi.com) packs a graphical lineage view with the caveat that it only works within a workspace. As a Power BI admin, you may need a utility to inventory all Power BI artifacts published to all workspaces (including My Workspaces) in your Power BI tenant. Fortunately, the Admin – Groups GetGroupsAsAdmin can do the job in one call without any coding! Don’t be misled by “groups” in the API name as groups are equivalent to workspaces (the original V1 workspaces were joined by the hip with O365 groups so Microsoft got carried away here, which I’m sure they regret by now given than V2 workspaces decoupled from groups :-).

  1. Go to the API page and click the “Try it” button (isn’t great that you can test any Power BI API without writing a single line of code?). Sign in with your Power BI credentials when prompted.
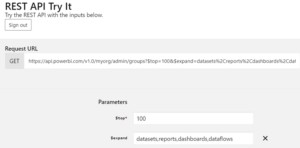
  2. Enter a value for the $top parameter to limit the number of workspaces returned. It must be withing the 1-5000 range.
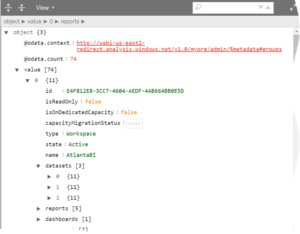
  3. Add a $expand parameter and specify what artifacts you’re interested in. Make sure to click the plus next to the parameter to add it to the API call. In the example below, I request all Power BI artifacts: datasets, reports, dashboards, and dataflows

Next run the API and get the results as JSON. You can use one of the online JSON viewers, such as the Code Beautify JSON Viewer, to get a user-friendly view of the data. The Tree Viewer is particularly useful to drill down a workspace to items.

Power BI Embedded, Service Principals, and AAS

In my previous post “Power BI Embedded, Service Principals, and SSAS“, I discussed how you can integrate Power BI Embedded (App Owns Data) configured for service principal authentication with SSAS to pass the effective user identity. One important observation is that you can use this approach with both internal and external users. For internal users, the Power BI gateway (running under an account that has admin rights to the SSAS instance) passes the effective user identity under the EffectiveUserName connection string setting. For internal users, the effective user identity maps to the user UPN, such as john.doe@prologika.com, so that AAS can map it to the corresponding AAS account. For external users, you can configure the gateway for CustomData, and pass whatever you want as an effective user identity.

Suppose that one day you migrate your code to Azure Analysis Services (AAS)? AAS. Will it work? Unfortunately, not. Since there is no gateway between Power BI and AAS, there isn’t a layer to authenticate using a trusted account. So, the Power BI team has decided to go only with CustomData instead and Power BI Embedded supports a special parameter which only works for AAS . Although the documentation doesn’t emphasize this difference, it has an important paragraph “The only way to have dynamic RLS (which uses dynamic values for filter evaluation) in Azure Analysis Services, is using the CUSTOMDATA() function”. Let’s break this down.

  1. You must use the Object ID of the service principal account when you construct your effective identity. See my previous blog of how to obtain that identifier. Attempting to pass anything other than the Object ID will result in a Forbidden error when the code attempts to obtain the embed token by calling client.Reports.GenerateTokenInGroup().
    var identity = new EffectiveIdentity(“<Object ID GUID>”, new List<string> { report.DatasetId }, customData:“someuser@acme.com”);
  2. You must use the customData parameter to pass whatever identifier your AAS row-level security will use to authorize the interactive user. DAX can obtain this identifier from the CUSTOMDATA() function.
  3. You must add the service principal Object ID to each AAS security role in which the user needs to be evaluated.

Your Power BI Embedded App Owns Data implementation will need different code for SSAS and AAS. The AAS version relies on CUSTOMDATA for handling row-level security.

Although this implementation path is fundamentally different from SSAS, it will work with external users that are not part of your Azure AD. But users registered in Azure AD cannot be just added to AAS roles. This will be pointless because you won’t be able to pass their identity under EffectiveUserName and AAS won’t be able to evaluate them as AAD users. So, both internal and external users must go somehow through CUSTOMDATA.

Prologika Newsletter Spring 2020

Do you know that according to Gartner, at least five of the top 10 technology trends for 2020 will involve predictive analytics? And the third on the list is “democratization” to deliver it to non-specialists. With the growing demand for predictive analytics, Automated Machine Learning (AutoML) aims to simplify and democratize predictive analytics so business users can create their own predictive models. The promise of AutoML is to bring predictive analytics to business users, just like Power BI democratizes data analytics, Power Apps democratizes app dev, and Power Query democratizes data shaping and transformation.
 

Comparing Options

As a business user, the two most popular options for applying Automated Machine Learning for predictive analytics are Power BI and AzureML. Behind the scenes, Power BI AutoML uses the automated machine learning feature of AzureML but there are differences and I summarize below the most important ones.

  Power BI AutoML Azure AutoML
Licensing Power BI Premium Azure ML (Enterprise Edition recommended)
Container Dataflow Experiment
Power Query Available Not available
Supported data sources Many A few (local files, Azure SQL DB, ADLS, and a few more)
Model Not Accessible (Power BI handles everything) Accessible
Web service endpoint Not available outside Power BI Available for app integration
Scoring Apply the model to entity Various options (Notebooks, SDK, custom integration)

To me, the best solution would have been the combination of both technologies. I like Power Query for sourcing, shaping and transforming the data, but I also like the flexibility that AzureML brings. Unfortunately, you can’t mix and match. It appears that AzureML has decided to roll out their own data connectivity mechanism and as a result, it supports a limited number of data sources (for example, on-prem data sources are not accessible). I expect this to change as the product evolves.

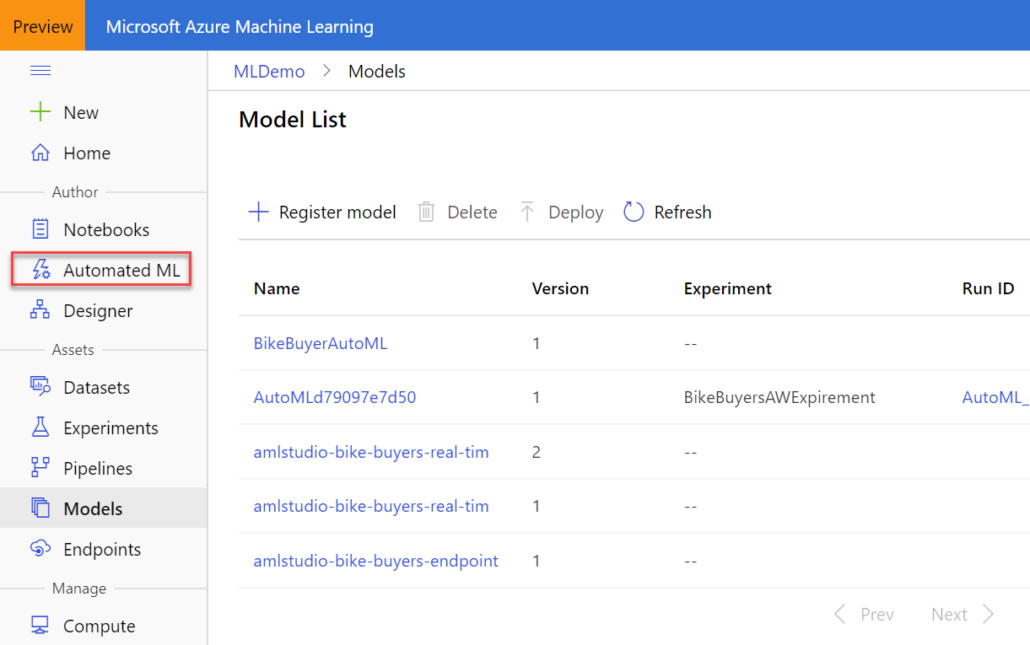
Azure ML Studio

I’ve done recently some work with the new version of Azure ML Studio (https://ml.azure.com/), and I’m impressed. Microsoft has learned important lessons from the previous AzureML (now called “classic”) and greatly enhanced the product. If you’re looking for a SaaS ML toolset that targets both business users and data scientists, AzureML should be on the top of your list. Speaking of its AutoML feature, the main advantages that it brings for predictive analytics are:

  • Determining the model type – classification, regression, and time series forecasting (the last one is not available yet in Power BI)
  • Automatic featurization
  • Selecting the best algorithm – For example, the screenshot below shows how AzureML has tested various algorithms and determined that VotingEnsemble performs the best.

Even if you’re a data scientist, the best algorithm selection feature alone justifies giving AutoML a try – if not for anything else but to select the best algorithm so that you don’t have to spend enormous time testing different algorithms.

NullToZero in Power BI and Tabular

Null and zero typically have different semantics, where null indicates an unknown or missing value while zero is an explicit value. Sometimes, however, you want to show nulls as zeros. For example, an insurance company might want to show 0 claims instead of a blank value. By default, when a DAX filter doesn’t find any rows, the formula returns null (BLANK in DAX). For example, this Claims Count measure will return null when no claims match the report filters.

Claims Count = DISTINCTCOUNT(FactClaims[UniqueClaimNumber])

How do we show nulls as zeros?

The easiest and fastest way is to simply append zero.

Claims Count = DISTINCTCOUNT(FactClaims[UniqueClaimNumber]) + 0

Note that the storage engine is optimized to eliminate empty spaces so converting measures to zero can impact performance negatively. In addition, by default, reports remove dimension members with empty measures. This won’t happen if measures return zero.

Power BI Report Books

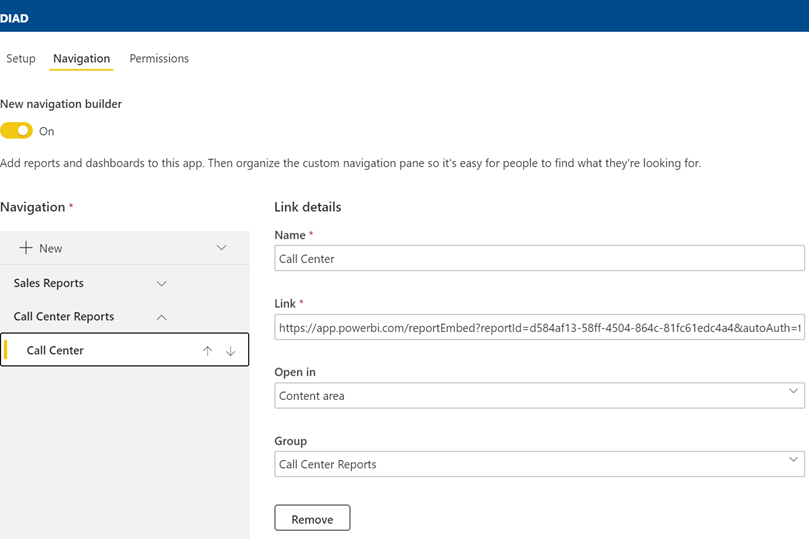
Scenario: Management has requested an easy way to view a subset of strategic reports located in different Power BI workspaces. You can ask the users to mark reports and dashboards as favorites so they can access pertinent content in the Favorites menu, but you’re looking for an easier configuration, such as to create a book of reports with a built-in navigation that organizes reports in groups (like a table of contents), such as the screenshot below demonstrates.

021520_1921_PowerBIRepo1.png

Workaround: Creating a Power BI app might be your best option. However, a long-standing limitation of apps is that there is 1:1 relationship between an app and a workspace. Therefore, by default all included content must come from the same workspace and you can’t create multiple apps in a workspace, such as to distribute content to different audiences.

But thanks to the upgraded navigation experience, an app can include links to reports in other workspaces if consumers have at least Viewer permission to these workspaces.

  1. Start by deploying the core set of reports that you want to distribute to a workspace, such as an Executive Reports workspace. This workspace will serve as a base for the app.
  2. Create an app. In the Navigation tab, the app will already include sections for each distributed report. Add links to reports in other workspaces and organize them in group.
  3. To prevent external reports “losing” the navigation experience, specify the report embed URL which you can obtain by opening the report in Power BI Service, and clicking the Embed , “Website or portal” menu. Then, copy the URL (not the iframe element) and use it as the link.
  4. Grant permission to the appropriate users or groups.
  5. (Optional) Upload an image for the app logo so end users can tell the app apart from other apps.

Here is a configuration for a report residing in a different workspace. Notice that to preserve the navigation experience, the report is configured to open in the page content.

021520_1921_PowerBIRepo2.png

There are two main caveats of this approach:

  1. Users must have permissions to the workspaces (except the app workspace) where the distributed reports reside. The app permissions you set up don’t propagate to content outside the app workspace.
  2. App consumers are not isolated from changes to the external reports. By default, an app propagates content changes to included content only when the app is updated. End users will see changes to external content even if the app is not updated.

Power BI Report Slide Show

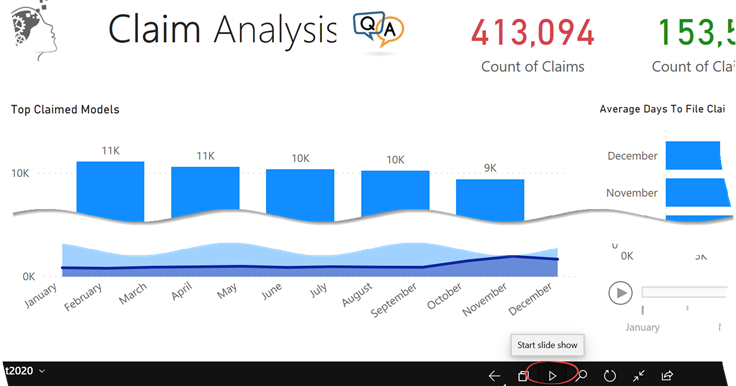
Scenario: You plan to display a Power BI report on a monitor. You want the report to automatically cycle through report pages, showing each after a configurable time delay, like a photo slide show.

Solution: There are at least two solutions to accomplish this:

  1. The Microsoft-supported way is to install the Power BI Mobile for Windows and use its presentation mode feature, which is shown in the screenshot below.
  2. The open-source Chrome “Power BI Real Time Slideshow” extension.

021320_2308_PowerBIRepo1.png