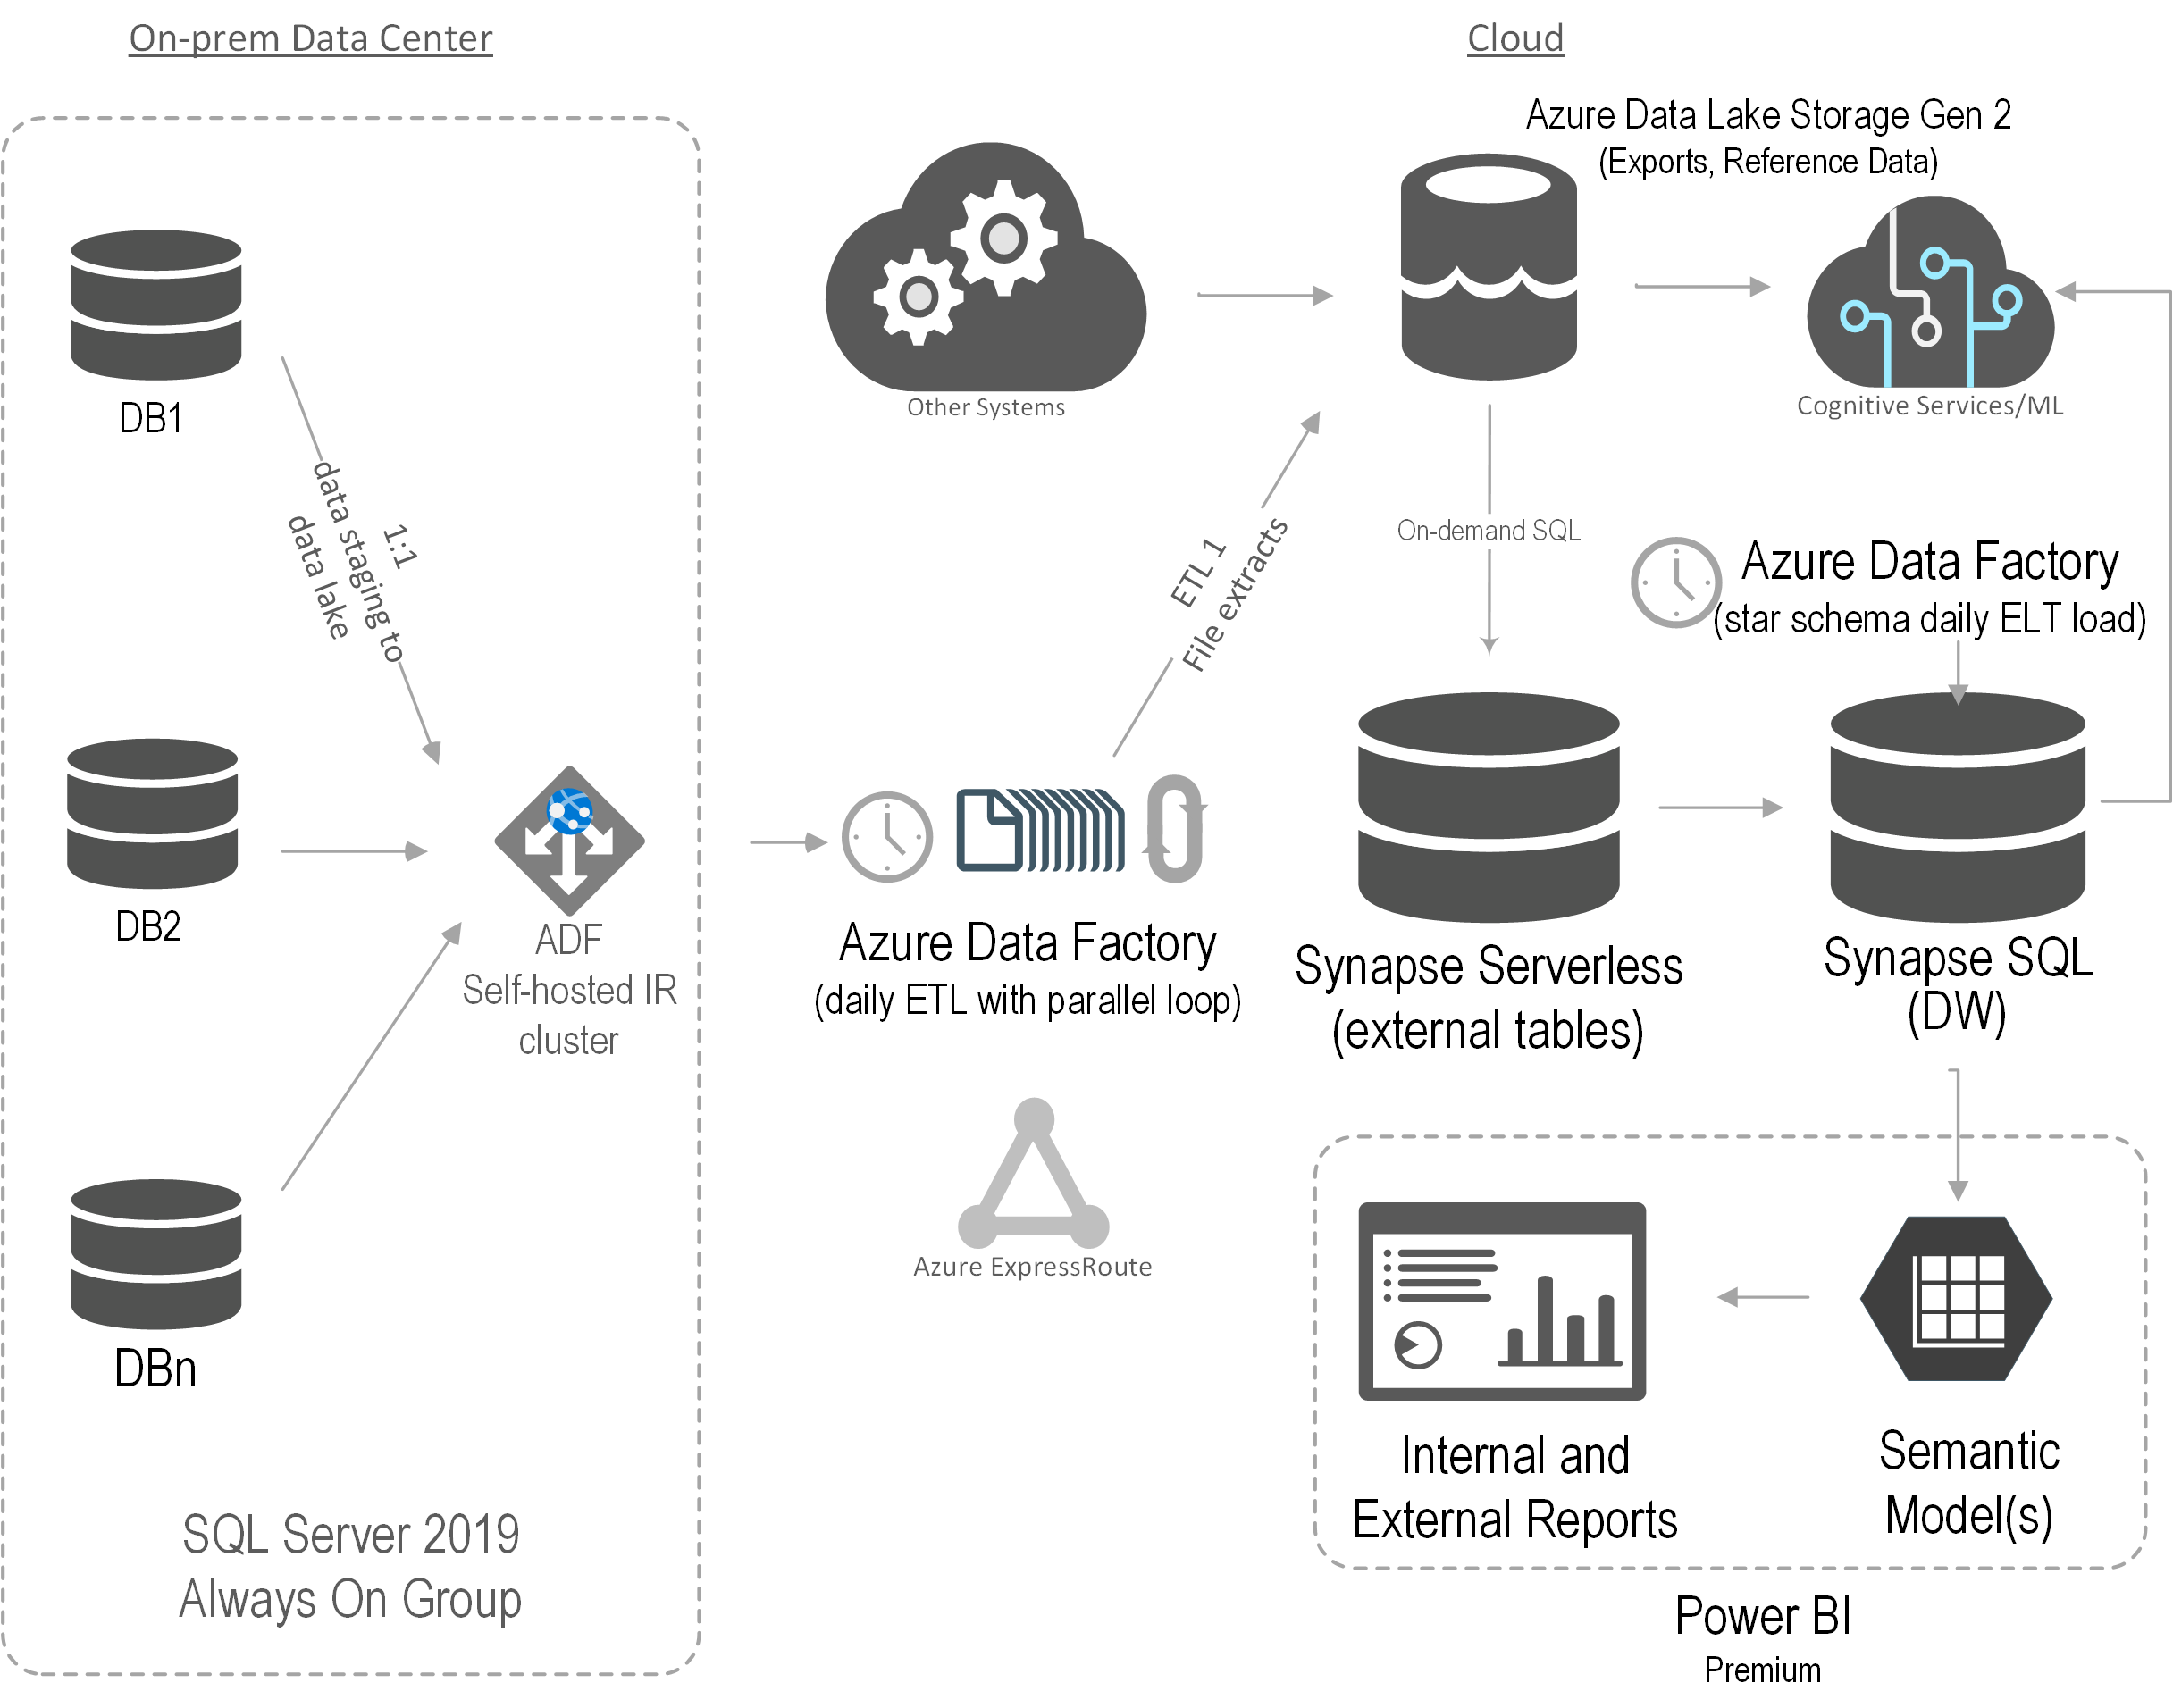
Drillthrough Paginated Reports
I’m helping a client convert a few SSRS reports from SharePoint to Power BI Premium Per User (PPU). SSRS is of course near and dear to my heart because of all the work I’ve done around it circa 2004-2010 (yep, it’s been that long), books, MVP awards, etc. Since its humble beginnings, SSRS have had a solid architecture that excelled in extensibility. You’d be hardly pressed to face a requirement that couldn’t meet with SSRS back then.
Unfortunately, most of these extensibility features, such as custom assemblies, custom security, custom delivery extensions, custom renderers (essentially everything related to custom code) didn’t make it to paginated reports in Power BI Premium. Not many companies are using these features, so they probably won’t be a showstopper for your migration. To their credit, Microsoft is closing the gap between SSRS and paginated reports. As of now, the feature limits that you might run into are:
| Missing Feature | Workaround |
| Shared data sources/datasets | Report-specific (embedded) data sources/datasets (yep, a maintenance nightmare) |
| Drillthrough report actions | Change to URL action and provide URL to drillthrough reports passing filters on the URL |
| Document map | No workaround |
Instead of drillthrough report actions, implement URL-based actions. Assuming embedding for your organization, here are the high-level steps:
- Deploy the drillthrough report to Power BI. Again, you must deploy to a Premium or PPU workspace. Run the report. It should run successfully. Go to File, Embed menu and copy the iframe code (assuming you want to embed the report in your company’s portal). The iframe code should look like this:
<iframe width="800" height="600" src="https://app.powerbi.com/rdlEmbed?reportId=b82ed928-d9d9-42b5-b6cc-a6e8f3e9dc4d&autoAuth=true&ctid=<your tenant id>" frameborder="0" allowFullScreen="true"></iframe>
-
Open the main report in Visual Studio or Power BI Report Builder. In the report properties, Code tab, define a public constant to the drillthrough report(s). Or, you can define internal parameters.

- Now find all instances of drillthrough actions in the main report. If there are many, it might be easier to open the report RDL in Visual studio and search for <Drillthrough>. For each textbox with drillthrough replace the Drillthrough section in the <ActionInfo> element with a Hyperlink, such as
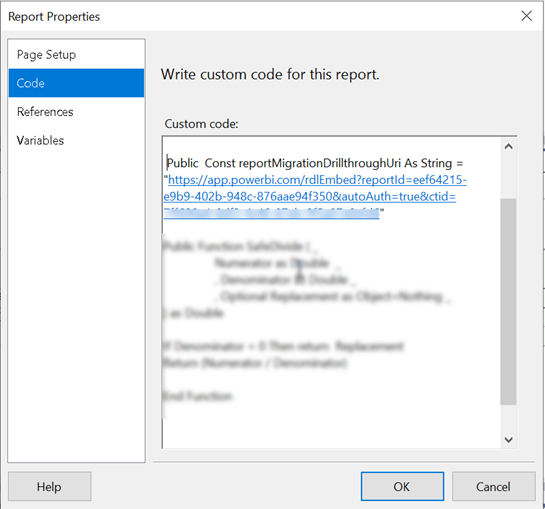
<ActionInfo> <Actions> <Action> <Hyperlink>=String.Format("{0}&rp:ProfileID={1}&rp:Month1={2}&rp:Month2={3}", Code.reportMigrationDrillthroughUri, Parameters!ProfileID.Value, Parameters!Month1.Value, Parameters!Month2.Value)</Hyperlink> </Action> </Actions> </ActionInfo>
- In the example above, the positional string replace will replace the {0} placeholder with the report drillthrough constant you defined before. Then, you provide values for the drillthrough report parameters (in this case, the drillthrough report takes three parameters).
- Test the main report and drillthrough links. If all is well, publish the main report to Power BI. Obtain its embedded iframe code and add it to your app page.
Use the secure embed iframe URL for the main report so that it’s embedded in the app instead of opening in a new browser tab. Unfortunately, the drillthrough reports will open in a separate tab and I couldn’t find a workaround to render them inside the iframe of the main report.