Atlanta MS BI and Power BI Group Meeting on December 6th

Please join us online for the next Atlanta MS BI and Power BI Group meeting on Monday, December 6th, at 6:30 PM ET.  To finish the year at a high note, the famous Guys in the Cube (Patrick and Adam) will tell us how keep the data fresh in Power BI. And your humble correspondent will update you on the Power BI latest.  For more details and sign up, visit our group page.

Presentation:Keeping your Data Fresh in Power BI
Date:December 6th
Time:6:30 – 8:30 PM ET
Place:Click here to join the meeting
Overview:We all want our data refresh to happen quickly so the most current data is available for our reports. In this session we will walk you through options to configure refreshing your data but more importantly we will help with performance. We’ll look at how to identify bottlenecks and then how to optimize at different points to get the most out of your Power BI refresh.
Speaker:Patrick LeBlanc is a currently a Principal Program Manager at Microsoft and a contributing partner to Guy in a Cube. Along with his 15+ years’ experience in IT he holds a Masters of Science degree from Louisiana State University. He is the author and co-author of five SQL Server books. Prior to joining Microsoft, he was awarded Microsoft MVP award for his contributions to the community. Patrick is a regular speaker at many SQL Server Conferences and Community events.

Adam Saxton is just a guy in a cube doing the work! He is on the Power BI CAT team at Microsoft working with customers to help adopt Power BI. He is based in Texas and started with Microsoft supporting SQL Server connectivity and Reporting Services in 2005.

Prototypes without PizzaPower BI Latest

PowerBILogo

Power BI Bookmark Navigator – A Better Hack

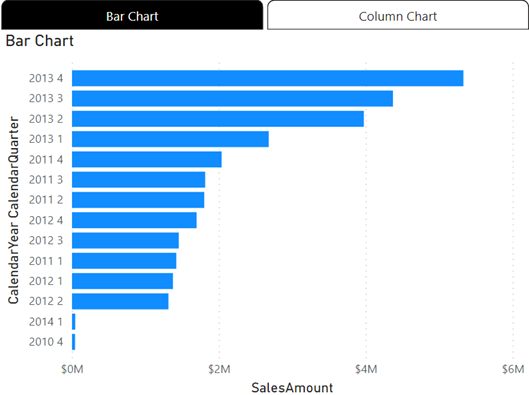
As a report author, you are constantly pressed to fit more visuals into a single page. The November release of Power BI Desktop introduced the Power BI Bookmark Navigator, which simplifies the process of creating a tabbed interface, such as this one.

Since Power BI doesn’t support visual containers or a “menu” visual, you must resort to the awful hack of hiding and showing UX elements by bookmarking them. This reminds me of the beginning of my career as a developer where we didn’t have widgets and we had to hack our way through implementing a custom navigation “experience” by toggling visibility. Alas, this continues in the 21st century but at least the hack got simplified. To implement the tabbed interface:

  1. Add two (or more) overlapping visuals.
  2. Add two bookmarks (Bar Chart and Column Chart) that show and hide the appropriate visual. Don’t worry about hidden visuals impacting the report performance because Power BI doesn’t process them.
  3. Add the two bookmarks to a Tabbed Interface bookmark group.
  4. In Report View, go to the Insert ribbon, expand the Buttons menu, and then click Navigators, “Bookmark navigator”.

Currently, Power BI supports two navigators. The “Page navigator” adds a tabbed navigation menu with a tab for each report page to let the user navigate to a given page by clicking the corresponding tab. The navigator that will inspire more interest is the “Bookmark navigator”.

  1. Notice that by default the navigator adds a tab for each bookmark defined in the report, but in this case, you just need to restrict it to the two bookmarks that you previously created. With the navigator selected, expand the Bookmarks section in the “Format navigator” pane, and select the “Tabbed Interface” bookmark group.
  2. Position the navigator above the two visuals. Remember that in Power BI Desktop, you need to press Ctrl when you click that navigator tabs to switch between the visuals.

Limitations and bugs:

  1. The previously selected tab gets stuck in a highlighted state, so you must hover on it to make it appear “unselected”.
  2. Hierarchical navigation is not supported. For example, you might want to build a page navigation experience like in Power BI apps. However, you can’t define a hierarchy, such as to start the user at the bookmark group level and then drill down to bookmarks.
  3. Although you can somewhat customize the tab appearance, no UX designer will probably be impressed. For example, one feature that could be useful to free up more page real estate is to be able to toggle the navigator visibility.

“Serverless” Lessons Learned

I’ve architected and currently implementing a solution that uses Synapse (my last newsletter has the details, plus the architecture diagram). Synapse Serverless is the Microsoft answer to Amazon Athena but instead of using open-source tools like Presto, it’s built on SQL Server. In this project we extract many tables from 1,500 on-prem SQL Server databases and stage them in ADLS.

From there we use Synapse Serverless to virtualize these files as tables that we query with T-SQL to load the source “table” data into a data warehouse hosted in Synapse SQL Pool. I have to tell you that I’m becoming a “serverless” fan.

Here are a few lessons learned from this project:

  1. Save the files in parquet format in ADLS. Parquet can be compressed. It’s columnar based, it’s much faster to query. Serverless automatically creates statistics for parquet files on the first query and each time it detects changes.
  2. Less files result in better ETL performance – We compared the results of querying a virtual table that is based on 1,500 files (one file per database) vs. a single file (by sending a T-SQL SELECT…UNION ALL SELECT query) that combines the data from all databases for that table. The single file outperforms the many files by far. First, the ETL process is a way faster because ADF doesn’t have to queue each copy activity. So, even if the file is small and takes a few seconds to copy over, time quickly adds up so you might find that you have to scale up your ADF self-hosted runtime and increase parallelism in ADF loops. For example, uploading all these files would take an hour vs. 40 seconds for a single file.
  3. Less files results in better query performance – We observed similar results when querying a virtual table in Synapse Serverless. In the case where the table was virtualized on top of many files, it took about 15 seconds to count the rows in the table and even longer to execute a single WHERE clause. By contrast, a virtual table on top of a single file was almost instantaneous.
  4. Don’t be afraid of schema differences – The chances are that different databases may have slightly different schemas, such as data types mismatch or extra columns exist in some tables. A great feature of Synapse Serverless is that the columns of the virtual table are the superset of all possible columns in the source. If a file doesn’t include a column, an empty column is returned.

To make my joy complete, I hope at some point Microsoft would support native integration between SQL Pool and Serverless so we don’t copy the data over. Although SQL Server-based, currently SQL Pool and Serverless are two separate sources. In our case we had to use ADF to extract data from Synapse Serverless and stage it in the SQL Pool before the final transformation to the data warehouse.