Atlanta MS BI and Power BI Group Meeting on February 7th

Please join us online for the next Atlanta MS BI and Power BI Group meeting on Monday, February 7th, at 6:30 PM ET.  Your humble correspondent will show you different techniques to implement scorecards with Power BI. For more details and sign up, visit our group page. Download the presentation assets here.

Presentation:Implementing Scorecards
Date:February 7th
Time:6:30 – 8:30 PM ET
Place:Click here to join the meeting
Overview:Join this session to learn how to create scorecards measuring strategic objectives with Power BI. We’ll start by introducing you to balanced scorecards and KPIs. Then, I’ll compare different ways to assemble scorecards, including:

·       Conditional formatting

·       Analysis Services KPI

·       Power BI Goals

Demos will make it all clear. As a bonus, you’ll learn some black-belt modeling techniques, such as using Tabular Editor where Power BI Desktop falls short.

Speaker:Teo Lachev is a consultant, author, and mentor, with a focus on Microsoft BI. Through his Atlanta-based company Prologika (a Microsoft Gold Partner in Data Analytics and Data Platform) he designs and implements innovative solutions that bring tremendous value to his clients. Teo has authored and co-authored several books, and he has been leading the Atlanta Microsoft Business Intelligence group since he founded it in 2010. Microsoft has recognized Teo’s contributions to the community by awarding him the prestigious Microsoft Most Valuable Professional (MVP) Data Platform status for 15 years. In 2021, Microsoft selected Teo as one of only 30 FastTrack Solution Architects for Power BI worldwide. https://prologika.com
Prototypes without PizzaPower BI Latest

PowerBILogo

DirectQuery Performance Progression

So much data, so little budget! Caching data in Power BI gives you the best report performance, but budget constraints usually put downward pressure to stay within lower Power BI Premium premium plans. So, what to do?

  1. Split large models. Remember that Power BI Premium Gen2 grants each dataset a 25 GB memory quota. I’m actually a big proponent for consolidated organizational semantic models, but this is where best practices meet reality.
  2. Switch large tables to DirectQuery. When report performance sucks, follow this performance optimization progression:
    1. Add a columnstore index to the fact table – As VertiPaq, a columnstore index organizes data in columns so aggregate queries should see an immediate performance boost. Detail-level queries, e.g. sales by customer, not so much as they probably won’t hit the index.
    2. Try hybrid tables when you can get away with a compromise where the latest data can be cached, but archive data left in DirectQuery.
    3. Try aggregation tables (first automatic, then manual) when you need to speed up aggregate queries at a higher-level grain, such as dashboard queries but leave lower-level queries pass through.
    4. Pray for mercy to come! Or take the stakeholder out for lunch and insist that the time for some compromise has come…

Azure Learning Path

I’m preparing for the new Azure Data Engineer exam, which is one of options to maintain a Gold Certification for Data Analytics for MS partners that has to be renewed annually. I’m really impressed by the Azure Learning Path self-paced environment that Microsoft put together. The training material is top-notch, and I actually learn some practical and useful stuff from the covered topics on ADLS, ADF, Synapse, etc. And you can even practice in an Azure sandbox environment that Microsoft sets up and tears down for you! It’s clear that tremendous effort has gone into setting this online and free learning option. No excuse to not certify anymore …

Check it out the online learning option for exam DP-203 at https://docs.microsoft.com/en-us/learn/certifications/azure-data-engineer/.

Applied Power BI Book (7th Edition)

Happy New Year!

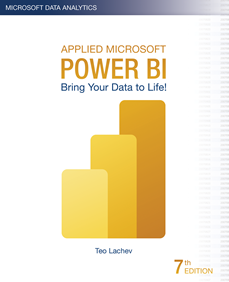
I’m excited to announce the availability of the seventh edition of my Applied Microsoft Power BI book! When the first edition was published  in January 2016, it was the first Power BI book at that time and it had less than 300 pages. Since then, I helped many companies adopt or transition to Power BI and taught hundreds of students. It’s been a great experience to witness the momentum surrounding Power BI and how the tool has matured over time. As a result, the book also got thicker and doubled in size. However, I believe what’s more important is that this book provides systematic, yet dependent, view by showing what Power BI can do for four types of users (business users, analysts, pros, and developers).

For the first time, the book features a Kindle PDF (Amazon Print Replica) ebook version which replaces the Kindle native “reflow” format previously used. Now if you buy the ebook, you will read it on your Kindle device or phone exactly as it was formatted to print the paperback! The ebook is also enrolled in Kindle Unlimited – an Amazon subscription program where you can read as many eBooks as you like and keep them as long as you want.

To my understanding, this is the only Power BI book that is revised annually to keep it up to date with this ever changing technology! Hint: you can tell how old Power BI is from the book’s edition number.

Because I had to draw a line somewhere, Applied Microsoft Power BI (7th edition) covers all features that are in preview or released by December 2021. As with my previous books, I’m committed to help my readers with book-related questions and welcome all feedback on the book discussion forum on the book page. While you are there, feel free to check out the book resources (sample chapter, front matter, and more). I also encourage you to follow my blog at https://prologika.com/blog and subscribing to my newsletter at https://prologika.com to stay on the Power BI latest.

Bring your data to life for the seventh time! Keep on reading and learning!