Testing RLS with Power BI Shared Datasets

In a typical engagement, I create an organizational semantic model(s) and “report packs”, such as Sales Report Pack, Inventory Report Pack, etc. These report packs are typically implemented as Power BI reports connected to the semantic model as a shared dataset using the Power BI Datasets connector. Reports sanctioned by IT are published to a dedicated workspace, such as Corporate BI. Departmental reports are deployed to their respective workspace, such as Sales, to enforce content-level security. Usually, the semantic model has row-level security (RLS) roles defined to enforce restricted access to data depending on the identity of the interactive user.

Although not immediately obvious, here is how you can test RLS to ensure that connected reports produce expected results under someone else’s identity directly in Power BI Service:

  1. In powerbi.com, go to the workspace where the shared dataset is published.
  2. In the dataset page, click the Datasets tab, and then click the ellipsis button (…) next to the shared dataset. In the dataset Settings, click Security.
  3. Expand the … button next to the Restricted Access role, and then click “Test as role”. This will open whatever report is included in the shared dataset pbix file (I typically have some reports there for testing).
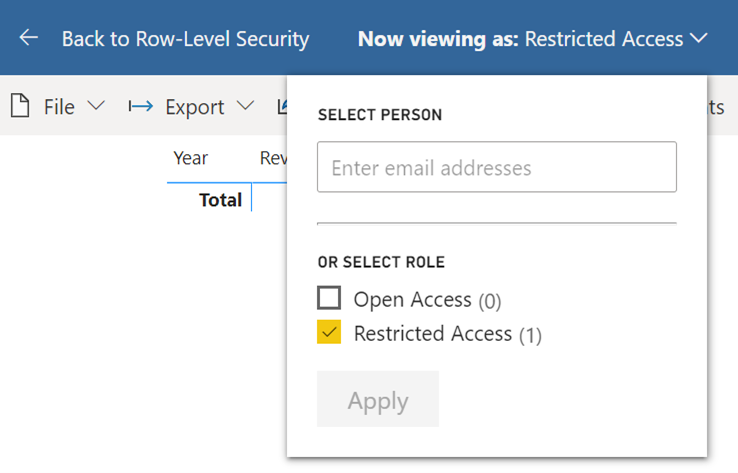
  4. You can expand the Restricted Access dropdown and enter the user email of the user whose RLS permissions you want to test or the role you want to apply. In the screenshot below, I’m testing under my identity applying the rules in the Restricted Access role. If I wanted to test what a specific user would see, I’d type in that user’s email.
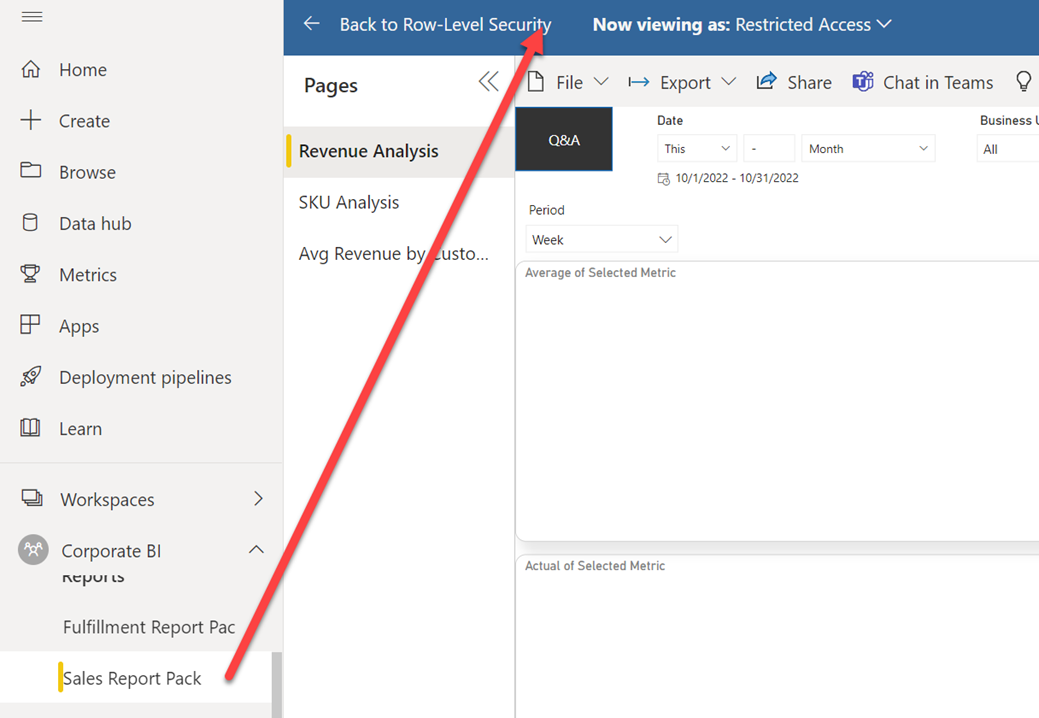
  5. To test other reports for this user, expand the powerbi.com left-navigation pane and then click the desired report. Power BI will navigate you to that report, but it will honor RLS.

Correlating Analysis Services Errors with Measures

This blog builds upon my previous “Resolving Tabular Conversion Errors” and applies to Analysis Services in all flavors (Power BI, MD, and Tabular). In the scenario I described in the previous blog, the server at least told us the name of the offending measure in the error description. But sometimes you might not be that lucky. For example, recently I got this error when running a DAX query requesting many measures: “Microsoft OLE DB Provider for Analysis Services.” Hresult: 0x80004005 Description: “MdxScript(Model) (2000, 133) Failed to resolve name ‘SYNTAXERROR’. It is not a valid table, variable, or function name.” All we know is that there is a syntax error in some measure but good luck finding it if you have hundreds of measures in the query and your model. However, the (2000,133) section references the line number and column number in the MDX script (Yeap, MDX even if you use Tabular), so if we can get the script, we might be able to correlate the error.

Getting that script is elusive as the only way I know off for Tabular models is to trace the “Execute MDX Script Begin” or “Execute MDX Script End” events. But these events are generated only the first time a user with a given set of role permissions connects to a cube after processing, clearing the cache, or restarting the server. So, after you connect the SQL Server Profiler to the cube and check either of these two events (you must click Show All Events because the events are not shown by default), you can execute Clear Cache or process a table. Then, connect to the cube and execute any MDX or DAX query. In the Profiler, locate the “Execute MDX Script Begin” event. The payload should start with CALCULATE followed by all measure definitions.

CALCULATE;
CREATE MEMBER CURRENTCUBE.Measures.[__Default measure] AS 1; ALTER CUBE CURRENTCUBE UPDATE DIMENSION Measures, Default_Member = [__Default measure];
CREATE
MEASURE'Date'[Days Current Quarter to Date]=COUNTROWS( DATESQTD( 'Date'[Date]))
MEASURE'Date'[Days in Current Quarter]=COUNTROWS( DATESBETWEEN( 'Date'[Date], STARTOFQUARTER( LASTDATE('Date'[Date])), ENDOFQUARTER('Date'[Date])))
MEASURE'Internet Sales'[Internet Distinct Count Sales Order]=DISTINCTCOUNT([Sales Order Number])
….

Copy that payload and paste it in an editor that has line numbers, such as Notepad++. Then go to the line number (you can press Ctrl+G in Notepad) mentioned in the error description.

Using this technique, I was able to narrow down the measure and discovered that I’ve missed a comma in the DIVIDE DAX function. I’ve made the change in the Tabular Editor, but it didn’t catch the syntax error.

Resolving Tabular Conversion Errors

A scheduled SSIS job that executes a massive DAX query to an on-prem Tabular server (Power BI can also generate this error) one day decided to throw an error “Source: “Microsoft OLE DB Provider for Analysis Services.” Hresult: 0x80004005 Description: “MdxScript(Model) (2020, 98) Calculation error in measure ‘Account Snapshot'[Average utilisation % of all CR active current accounts last 3 months]: The result of a conversion or arithmetic operation is either too large or too small.” At least we know the offending measure, but which row is causing the error? The query requests some 300+ measures for 120 million customers, so I thought someone might find the troubleshooting technique useful. Let’s ignore what the measure does for now except mentioning that it performs a division of two other measures.

We can use the DAX ISERROR function to check if a measure throws an error. So, the first step is to wrap the measure with ISERROR and execute the query for all customers.

EVALUATE
FILTER (
 CALCULATETABLE (
 ADDCOLUMNS (
VALUES ( 'Customer'[Customer Registry ID] ),
"x", ISERROR ( [Average utilisation % of all CR active current accounts last 3 months] )
 ),
 FILTER ( VALUES ( 'Date'[Date] ), 'Date'[Date] = DATEVALUE ( "2022-10-14" ) )
 ),
 [x]
)

The query uses the ADDCOLUMNS function to add the measure so that it’s evaluated for each customer as of the date when the job ran. Make sure to add dependent measures that references the measure in the error description. ISERROR will return TRUE if the measure throws an error. The final step is to wrap CALCULATEDTABLE with FILTER that returns only the offending customer(s) where the measure is TRUE.

Using this technique, I’ve managed to narrow the error to data quality issues concerning large negative credit limits for some customers. BTW, the Tabular engine raises this error when converting a double precision floating point number to an integer, but the former is out of range of valid integer numbers.

Embedding Power BI Reports in Internal Portals

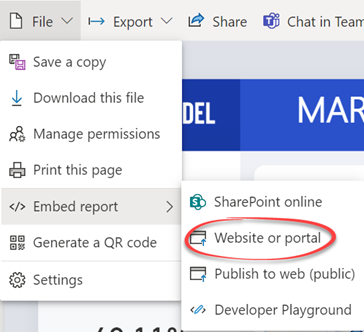
This question pops up over and over. What’s the easiest way to embed a Power BI or paginated report hosted in Power BI Service in an internal portal, such as a custom site developed by your team or on-prem SharePoint Server, so internal users can see all reports in one place? Use the “Embed report” feature that will give you a link or iframe code that you can readily add to the portal without any coding (notice that there is a SharePoint Online option because SharePoint Online has a special webpart for this purpose).

Will you get a single sign-on (SSO) so that the interactive user credentials automatically flow to Power BI? Nope. To the best of my knowledge, Power BI doesn’t support single sign-on even if your organization has extended its active directory to Azure, but let me know if you have found a workaround. The first time the user opens a Power BI report in the browser session, the user will get prompted to enter credentials. Then the user won’t be asked to authenticate when viewing subsequent reports in the browser session because the authentication token will be cashed in the browser session. The browser can also mitigate the issue by saving the user credentials until the password changes.

What if you want to avoid the prompt under any circumstance? Write code and use Power BI Embedded. Down the custom code rabbit hole we go… The upside is that you’ll get more control over the embedded reports thanks to the Power BI JavaScript library, such as if you want to replace the Filter Pane with your filtering mechanism.