Atlanta BI fans, please join us in person for the next meeting on Monday, April 1st at 6:30 PM ET. Aravinth Krishnasamy (Principal Architect at Ecolab) will provide an end-to-end overview of Microsoft Fabric real-time analytics capabilities. Your humble correspondent will help you catch up on Microsoft BI latest. CloudStaff.ai will sponsor the event. For more details and sign up, visit our group page.
Presentation: Real-Time Analytics with Microsoft Fabric: Unlocking the Power of Streaming Data
Delivery: In-person
Date: April 1, 2024
Time: 18:30 – 20:30 ET
Level: Beginner/Intermediate
Food: Pizza and drinks
Agenda:
18:15-18:30 Registration and networking
18:30-19:00 Organizer and sponsor time (events, Microsoft BI latest, sponsor marketing)
19:00-20:15 Main presentation
20:15-20:30 Q&A
Overview: This session will provide an end-to-end overview of Microsoft Fabric Real-Time Analytics capabilities. We will go over the following topics:
1. Introduction to Real-Time Analytics: Overview of the platform and its capabilities
2. Data Ingestion: How to ingest data from various streaming sources into Fabric
3. Data Analysis & Visualization: How to analyze and visualize data using Real-Time Analytics and Power BI
4. Use Cases: Real-world use cases for Real-Time Analytics.
Speaker: Aravinth Krishnasamy is a Principal Architect at Ecolab, where he focuses on business intelligence, data warehousing and advanced analytics applications. Aravinth holds numerous technical certifications and has over 18 years of IT experience.
Sponsor: CloudStaff.ai
https://prologika.com/wp-content/uploads/2016/01/logo.png00Prologika - Teo Lachevhttps://prologika.com/wp-content/uploads/2016/01/logo.pngPrologika - Teo Lachev2024-03-26 11:50:102024-03-26 11:50:10Atlanta Microsoft BI Group Meeting on April 1st (Real-Time Analytics with Microsoft Fabric: Unlocking the Power of Streaming Data)
One of the main goals and benefits of a semantic model is to centralize important business metrics and KPIs, such as Revenue, Profit, Cost, and Margin. In Power BI, we accomplish this by crafting and reusing DAX measures. Usually, implementing most of these metrics is straightforward. However, some might take significant effort and struggle, such as metrics that work at aggregate level. In an attempt to simplify such scenarios, the February 2024 release of Power BI Desktop includes a preview of visual calculations that I’ll review in this newsletter.
What’s a Visual Calculation?
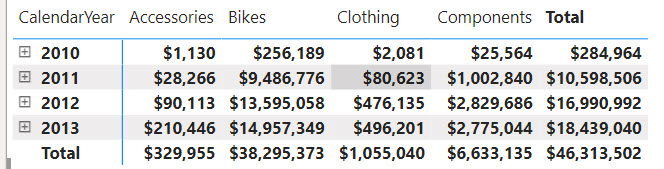
As its name suggests, a visual calculation is a visual-scoped DAX measure that works at the aggregate (visual) level. Don’t confuse the term “calculation” here with calculated columns, tables, or groups. Replace “calculation” with “measure” and you will be fine. Consider the following matrix:
Suppose you need a measure that calculates the difference between the product categories in the order they are sorted in the visual. Implementing this as a regular DAX measure is a challenge. Yet, if we had a way to work with the cells in the visual, we can easily find a way to get this to work. Ideally, this would work similar in Excel, but DAX doesn’t know about relative cell references. However, visual calculations kind of do.
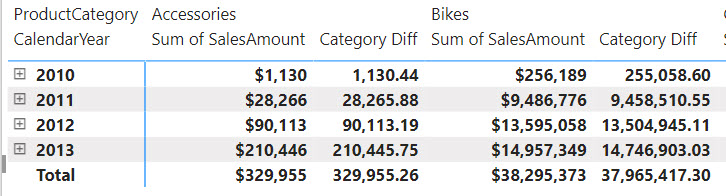
Let’s right-click on the visual and select “New calculation”. Alternatively, click the visual and then click the “New calculation” ribbon button in the Home ribbon. In the visual-level DAX formula bar, enter the following formula:
Category Diff = [Sum of SalesAmount] - PREVIOUS([Sum of SalesAmount], COLUMNS)
The Category Diff measure computes the difference between the current “cell” and the cell for the previous category. For example, for Bikes it will be $9,486,776-$28,266 (Accessories value).
The Good
As you can see, visual calculations can simplify aggregate-level metrics. Notice the use of the PREVIOUS function which is one the new DAX functions specifically designed for visual calculations. Notice also that the PREVIOUS function has additional arguments and one of them is the AXIS argument which specifies if the function should evaluate cells positionally on columns or rows. Traditional DAX functions don’t support the AXIS arguments because they are generic and not designed to operate on a visual level.
Finally, notice that visual-level formulas can only reference fields or measures placed in the visual. This is important as you’ll see later.
The Bad
Among the various limitations, the following will cause some pain and suffering:
1. You can’t export the data of a visual that has a visual calculation.
2. Drillthrough is disabled.
3. Can format visual calculations unless the visual supports it (the matrix visual does support measure formatting).
4. Can’t apply conditional formatting.
5. Can’t change sort order.
6. Can’t use field parameters.
The Ugly
The way Microsoft advertises this feature is that it is “easier than regular DAX” and performs better. My concern is that tempted by these promises, users will abuse visual calculations, such as for creating metrics that should be implemented as regular DAX measures so that any visual can benefit from them. And not before long, such users would find themselves into an Excel-like spreadmart hell which is what they tried to avoid by embracing Power BI.
I see a similar issue with DAX implicit measures, which Power BI users create by dragging a field and dropping it on a visual. I consider them a bad practice for a variety of reasons. Microsoft apparently doesn’t share the same concern (see their comments to my LinkedIn post on the same subject here). To their point, because visual calculations can only “see” fields placed in the visual, they naturally shield the user from abusing them. Let’s give it some time and see who’s right. Meanwhile, I wish this documentation article provides best practices and guidance on when to use implicit, explicit, and visual measures, including their limitations.
Visual calculations are incredibly useful but for limited scenarios. Therefore, please use these visual calculations only when regular DAX measures will not suffice. Business metrics should be centralized and should return consistent results, no matter the reporting tool or visual they are placed in. This is important for achieving the elusive single version of truth.
Previously, I discussed the pros and cons of Microsoft Fabric OneLake and Lakehouse. But what if you have a data lake already? Will Fabric add any value, especially if your organization is on Power BI Premium and you get Fabric features for free (that is, assuming you are not overloading your capacity resources)? Well, it depends.
Managed Area
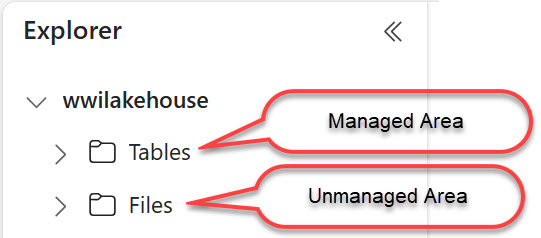
A Fabric lakehouse defines two areas: managed and unmanaged. The managed area (Tables folder) is exclusively for Delta/Parquet tables. If you have your own data lake with Delta/Parquet files, such as Databricks delta lake, you can create shortcuts to these files or folders located in ADLS Gen 2 or Amazon S3. Consequently, the Fabric lakehouse would automatically register these shortcuts as tables.
Life is good in the managed area. Shortcuts to Delta/Parquet tables open interesting possibilities for data virtualization, such as:
Your users can use the Lakehouse SQL Analytics endpoint to join tables using SQL. This is useful for ad-hoc analysis. Joins could also be useful so users can shape the data they need before importing it in Power BI Desktop as opposed to connecting to individual files and using Power Query to join the tables. Not only could this reduce the size of the ingested data, but it could also improve refresh performance.
Users can decide not to import the data at all but build semantic models in Direct Lake mode. This could be very useful to reduce latency or avoid caching large volumes of data.
Unmanaged Area
Very few organizations would have lakes with Delta Parquet files. Most data lakes contain heterogeneous files, such as text, Excel, or regular Parquet files. While a Fabric lakehouse can create shortcuts to any file, non Delta/Parquet shortcuts will go to the unmanaged area (Files folder).
Life is miserable in the unmanaged area. None of the cool stuff you see in demos happens here because the analytical endpoint and direct lake modes are not available. A weak case can still be made for data virtualization that shortcuts bring data readily available to where business users collaborate in Power BI: the Power BI workspace.
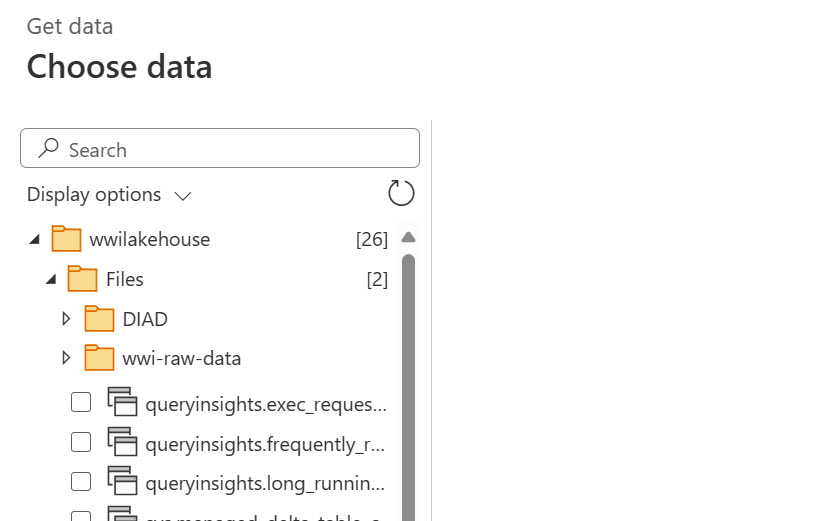
But what can the user do with these unmanaged shortcuts? Not much really. Power BI Desktop doesn’t even expose them when you connect to the lakehouse. Power BI dataflows Gen2 do give the user access to the Files folder so potentially users can create dataflows and transform data from these files.
Of course, the tradeoff here is that you are adding dependencies to OneLake which could be a problem should one day you decide to part ways. Another issue could be that you are layering Power BI security on top of your data lake security.
Oh yes, users can also load Parquet and CSV files to Delta tables by right-clicking a folder or a file in the Unmanaged area, and then selecting Load to Tables (New or Existing). Unfortunately, as it stands, this is a manual process that must be repeated when the source data changes.
Imagined Unmanaged Data Virtualization
This brings me to the two things that I believe Microsoft can do to greatly increase the value proposition of “unmanaged” data virtualization:
Extend load to table to the most popular file formats, such as JSON, XML, and Excel. Or, at least the ones that Polybase has been supporting for years. Not sure why we have to obsess with Delta Parquet and nothing else if Microsoft is serious about data virtualization.
Implement automatic synchronization to update the corresponding Delta table when the source file changes.
If these features are added, throwing Fabric to the mix could become more appealing.
In summary, Microsoft Fabric has embraced Delta Parquet as its native storage file format and has added various features that targets it. Unfortunately none of these features extend to other file formats. You must evaluate pros and cons when adopting Fabric with existing data lakes. As it stands, Fabric probably wouldn’t add much business value for data virtualization over file formats other than Delta Paquet files. As Fabric matures, new scenarios might be feasible to justify Fabric integration and dependency.
https://prologika.com/wp-content/uploads/2016/01/logo.png00Prologika - Teo Lachevhttps://prologika.com/wp-content/uploads/2016/01/logo.pngPrologika - Teo Lachev2024-03-13 14:19:362024-03-20 12:55:54What Can Fabric Do For My Lake?
Rounding up the wisdom from the inscriptions of the Apollo Temple (see the Nothing in Excess and Know Thyself posts), the last known famous inscription was “Make a pledge and trouble is at hand.” Although the original intention was lost in time, it’s believed that this inscription instructs us to understand our limits so we don’t overpromise.
Fast forward to modern data analytics, I remember how Microsoft Power BI started less than 10 years ago with the grand promise to democratize BI to the masses. One would believe that AI would be an essential ingredient to fulfill that promise. To its credit, Power BI includes various built-in and useful ML features, such as Analyze Increase/Decrease (my favorite), Decomposition Tree, Key Influencers, Get Insights, and Q&A.
It’s surprising to me though that Fabric copilots are an ultra premium feature as they require at least P1 or its Fabric equivalent of F64 capacity with a price tag of $8,600 per month. As such, they will be an option only for large organizations that can afford this budget. Apparently, Microsoft sees copilots as the cherry on top of the Fabric pie that will commit undecided customers to premium spending. What happened to democratization and increased productivity? Domains of the rich?
I can’t try the Fabric copilots because they aren’t available even with Fabric Trial. But judging from the demos Microsoft provided, I’m not that impressed with them anyway. They all seem poor code generators on top of the Microsoft OpenAI service.
I remember how Q&A and natural interfaces were supposed to revolutionize data analytics. Now I don’t know of anyone using Q&A, but it can certainly produce exciting demos. As another footnote to Gartner-inspired grand visions, Fabric copilots will probably follow the same fate with a faster acceleration because of their hefty price tag.
https://prologika.com/wp-content/uploads/2016/01/logo.png00Prologika - Teo Lachevhttps://prologika.com/wp-content/uploads/2016/01/logo.pngPrologika - Teo Lachev2024-03-11 13:09:152024-03-12 14:17:35Make a Pledge and Trouble is at Hand: Microsoft AI and Fabric Copilots

 One of the main goals and benefits of a semantic model is to centralize important business metrics and KPIs, such as Revenue, Profit, Cost, and Margin. In Power BI, we accomplish this by crafting and reusing DAX measures. Usually, implementing most of these metrics is straightforward. However, some might take significant effort and struggle, such as metrics that work at aggregate level. In an attempt to simplify such scenarios, the February 2024 release of Power BI Desktop includes a preview of