Please join us online for the next Atlanta MS BI and Power BI Group meeting on Monday, January 3rd, at 6:30 PM ET. Paul Turley will show us how to integrate Power BI with paginated (SSRS) reports. And your humble correspondent will update you on the Power BI latest. For more details and sign up, visit our group page.
Presentation:
Power BI Paginated Reports: The New Old Operational Reporting Platform
Power BI Paginated Reports (aka SQL Server Reporting Services) was old but now it’s new again. Available on-premises or in the Power BI service with flexible licensing, you have multiple options to implement operational reports. This session will briefly cover the differences between analytic and operational reports; and help you understand the advantages and trade-offs using Power BI Paginated Reports, Power BI Report Server and SQL Server Reporting Services. Material from our forthcoming book: Paginated Report Recipes.
Speaker:
Paul is a Principal Consultant for 3Cloud Solutions (formerly Pragmatic Works), a Mentor and Microsoft Data Platform MVP. He consults, writes, speaks, teaches & blogs about business intelligence and reporting solutions. He works with companies around the world to model data, visualize and deliver critical information to make informed business decisions; using the Microsoft data platform and business analytics tools. He is a Director of the Oregon Data Community PASS chapter & user group, the author and lead author of Professional SQL Server 2016 Reporting Services and 14 other titles from Wrox & Microsoft Press. Paul is a 2021 FastTrack Recognized Solution Architect and holds several certifications including MCSE for the Data Platform and BI.
Prototypes without Pizza
Power BI Latest
https://prologika.com/wp-content/uploads/2016/01/logo.png00Prologika - Teo Lachevhttps://prologika.com/wp-content/uploads/2016/01/logo.pngPrologika - Teo Lachev2021-12-27 16:11:462021-12-27 16:11:46Atlanta MS BI and Power BI Group Meeting on January 3rd
A while back a client wanted to avoid importing a large snapshot fact table with loan balances because its memory footprint would require them to upgrade to a higher Power BI premium plan. This of course required leaving the table in DirectQuery mode at the expense of query performance. Luckily, most users would be interested in the latest six months of data. To speed up performance, we opted for aggregations. However, to complicate things further, they had M2M relationships between dimensions and the fact table which Power BI aggregations don’t support. So, we had to roll out our own “aggregation hits” by redirecting DAX measures either to the aggregated table if the as-of date was in the last six months or to the DirectQuery table otherwise.
Seasoned BI pros might recall that Multidimensional supports measure groups with a mixed storage by creating MOLAP and ROLAP partitions within the same table. The recently announced Power BI hybrid tables carry this concept to Tabular models hosted in Power BI Premium or PPU. This enables two new scenarios:
Implement real-time “hot” partitions – For best report performance, you can continue importing and refreshing the data periodically, but you can also implement a “hot” partition configured for DirectQuery to show the latest changes. This is the scenario supported by the incremental refresh policy discussed in the announcement.
Leave infrequently accessed data in DirectQuery – This is the scenario that I believe would inspire more interest to address the above requirement.
Implementing real-time partitions
The easiest way to implement a real-time partition is by defining an incremental refresh policy. All you must do is check the “Get the latest data in real time with DirectQuery” checkbox. This will add a DirectQuery partition to the end of the partition design created by Power BI. When the scheduled refresh runs, Power BI will refresh the historical partitions as it would normally do. However, all queries that request data after the scheduled refresh date (at the day boundary) will be sent to the data source. Consequently, your model will have new data that is inserted into the table. I suggest you also configure the report pages that show the real-time data for automatic page refresh (in Power BI Desktop, select the page and turn on the “Page refresh” slider) so that the visuals poll for data changes at a predefined cadence.
Leave infrequently accessed data in DirectQuery
Think of this scenario as the opposite of the real-time partitions because the frequently requested data is imported while the historical data is DirectQuery. Because Power BI Desktop doesn’t support custom partitions, you must use another tool, such as Tabular Editor or SSDT, to configure the partitions by connecting it to the published dataset via the XMLA endpoint (or working with a local *.bim file). If you prefer Power BI Desktop, another option could be to create the partitions in a published test or production model, use Power BI Desktop for development, and configure deployment pipelines to propagate the changes and preserve the partition design in the non-development environments. You’d probably need only two partitions:
Historical partition – Specify a SQL statement that queries the historical data with a WHERE clause that qualifies rows using a relative date, such as six months before the system date. Change the partition mode to DirectQuery.
Current partition – Specify a SQL statement that defines the slice for the frequently used data. Change the partition mode to Import.
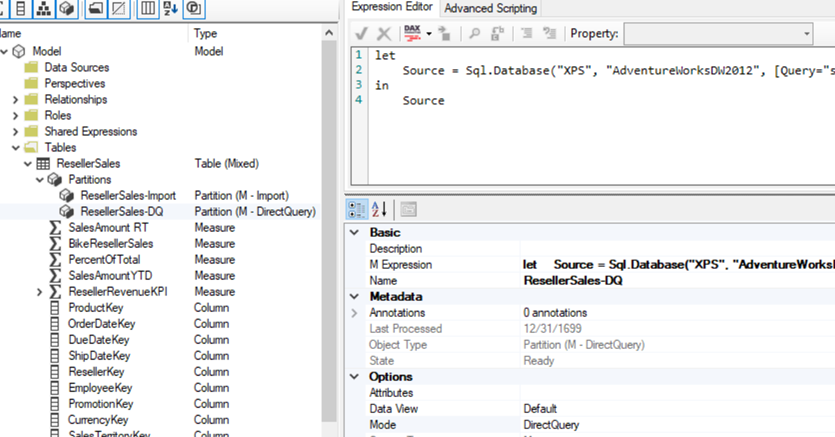
Here are the high-level steps to implement the custom partition design with Tabular Editor assuming you would create the partitions in a published dataset. Note that the first step use Power BI Desktop. You can use Tabular Editor for all steps but it’s a more advanced tool so you might want to use something you’re more familiar with.
Start by opening your dataset in Power BI Desktop. For best performance, drop all imported dimension tables that relate to the large fact table, reimport them in DirectQuery, and then change their storage mode to Dual. That’s because currently Power BI Desktop doesn’t let you switch from Import to DirectQuery and there is no workaround.
Open the Power Query Editor. By default, every table will have one partition and if you used Power BI Desktop, the partition will be an M partition (meaning it will have a Power Query). Change the Source step of the first partition to use a custom query (click the gear icon next to the Source step and then enter your custom SQL statement as per you requirements. For example, if you want the default partition to import the last six months and you target SQL Server, the Source step might look like this:
let
Source = Sql.Database("XPS", "AdventureWorksDW2012", [Query="select * from FactResellerSales where OrderDate >= DATEADD(month, -6, GETDATE())"])
in Source
Publish the dataset to Power BI Service. Close Power BI Desktop and promise yourself never to use it again for that dataset (if you can’t live without it, see the aforementioned note about deployment pipelines). That’s because if you republish the model, PBI Desktop will nuke the custom partitions in the deployed dataset (nice work here Microsoft). Remember that the only partition design supported and preserved by Power BI Desktop is the incremental refresh policy but you can’t use incremental refresh for this scenario.
Connect the Tabular Editor to the published dataset XMLA endpoint (File, Open, From DB). As a prerequisite, make sure to enable the XMLA Endpont for Read/Write in the capacity settings.
Rename the first partition, e.g. ResellerSales-Import.
Duplicate the partition and rename the second one ResellerSales-DQ. Change its Mode property to DirectQuery. Change its source query to slice the historical data.
let
Source = Sql.Database("XPS", "AdventureWorksDW2012", [Query="select * from FactResellerSales where OrderDate < DATEADD(month, -6, GETDATE())"])
in Source
Save (or deploy) the changes to Power BI Service and refresh the dataset.
(Optional) Open SQL Server Profiler connected to the published dataset. User Power BI Desktop or Analyze in Excel to create a report that queries the fact table by date. Notice that when the date filter falls within the last six months, there are no events in the profiler because the query is answered by the Tabular cache. However, when the date filter is outside that period, the profiler shows a SQL SELECT statement because that data is left in the data source to reduce the model’s memory footprint at the expense of performance.
This is what your partition design should look like:
Hybrid tables go even further than composite models by allowing you to mix storage modes within a table and having partitions in Import or DirectQuery storage modes. They enable two scenarios: real-time “hot” partitions and leaving infrequently accessed data in DirectQuery data. What I would like to see Microsoft improve in future is a) let us switch from Import to DirectQuery although this might break calculated columns and Power Query transforms, b) extend Power BI Desktop to support custom partitions so that we can connect Tabular Editor as an external tool and change the partition design and save it in the pbix file, and c) extend Power BI Desktop to preserve the partition design on deploy.
Please join us online for the next Atlanta MS BI and Power BI Group meeting on Monday, December 6th, at 6:30 PM ET. To finish the year at a high note, the famous Guys in the Cube (Patrick and Adam) will tell us how keep the data fresh in Power BI. And your humble correspondent will update you on the Power BI latest. For more details and sign up, visit our group page.
We all want our data refresh to happen quickly so the most current data is available for our reports. In this session we will walk you through options to configure refreshing your data but more importantly we will help with performance. We’ll look at how to identify bottlenecks and then how to optimize at different points to get the most out of your Power BI refresh.
Speaker:
Patrick LeBlanc is a currently a Principal Program Manager at Microsoft and a contributing partner to Guy in a Cube. Along with his 15+ years’ experience in IT he holds a Masters of Science degree from Louisiana State University. He is the author and co-author of five SQL Server books. Prior to joining Microsoft, he was awarded Microsoft MVP award for his contributions to the community. Patrick is a regular speaker at many SQL Server Conferences and Community events.
Adam Saxton is just a guy in a cube doing the work! He is on the Power BI CAT team at Microsoft working with customers to help adopt Power BI. He is based in Texas and started with Microsoft supporting SQL Server connectivity and Reporting Services in 2005.
Prototypes without Pizza
Power BI Latest
https://prologika.com/wp-content/uploads/2016/01/logo.png00Prologika - Teo Lachevhttps://prologika.com/wp-content/uploads/2016/01/logo.pngPrologika - Teo Lachev2021-11-29 19:04:242021-11-29 19:04:24Atlanta MS BI and Power BI Group Meeting on December 6th
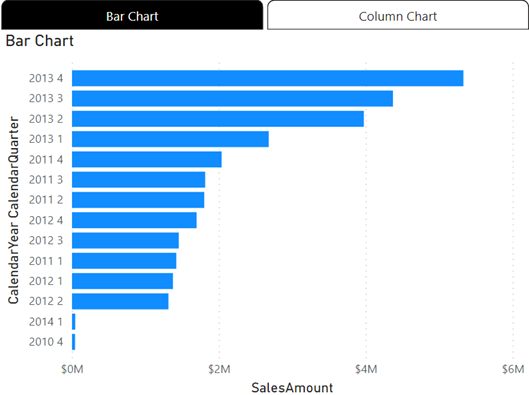
As a report author, you are constantly pressed to fit more visuals into a single page. The November release of Power BI Desktop introduced the Power BI Bookmark Navigator, which simplifies the process of creating a tabbed interface, such as this one.
Since Power BI doesn’t support visual containers or a “menu” visual, you must resort to the awful hack of hiding and showing UX elements by bookmarking them. This reminds me of the beginning of my career as a developer where we didn’t have widgets and we had to hack our way through implementing a custom navigation “experience” by toggling visibility. Alas, this continues in the 21st century but at least the hack got simplified. To implement the tabbed interface:
Add two (or more) overlapping visuals.
Add two bookmarks (Bar Chart and Column Chart) that show and hide the appropriate visual. Don’t worry about hidden visuals impacting the report performance because Power BI doesn’t process them.
Add the two bookmarks to a Tabbed Interface bookmark group.
In Report View, go to the Insert ribbon, expand the Buttons menu, and then click Navigators, “Bookmark navigator”.
Currently, Power BI supports two navigators. The “Page navigator” adds a tabbed navigation menu with a tab for each report page to let the user navigate to a given page by clicking the corresponding tab. The navigator that will inspire more interest is the “Bookmark navigator”.
Notice that by default the navigator adds a tab for each bookmark defined in the report, but in this case, you just need to restrict it to the two bookmarks that you previously created. With the navigator selected, expand the Bookmarks section in the “Format navigator” pane, and select the “Tabbed Interface” bookmark group.
Position the navigator above the two visuals. Remember that in Power BI Desktop, you need to press Ctrl when you click that navigator tabs to switch between the visuals.
Limitations and bugs:
The previously selected tab gets stuck in a highlighted state, so you must hover on it to make it appear “unselected”.
Hierarchical navigation is not supported. For example, you might want to build a page navigation experience like in Power BI apps. However, you can’t define a hierarchy, such as to start the user at the bookmark group level and then drill down to bookmarks.
Although you can somewhat customize the tab appearance, no UX designer will probably be impressed. For example, one feature that could be useful to free up more page real estate is to be able to toggle the navigator visibility.
https://prologika.com/wp-content/uploads/2016/01/logo.png00Prologika - Teo Lachevhttps://prologika.com/wp-content/uploads/2016/01/logo.pngPrologika - Teo Lachev2021-11-17 11:43:582021-11-17 11:43:58Power BI Bookmark Navigator – A Better Hack
I’ve architected and currently implementing a solution that uses Synapse (my last newsletter has the details, plus the architecture diagram). Synapse Serverless is the Microsoft answer to Amazon Athena but instead of using open-source tools like Presto, it’s built on SQL Server. In this project we extract many tables from 1,500 on-prem SQL Server databases and stage them in ADLS.
From there we use Synapse Serverless to virtualize these files as tables that we query with T-SQL to load the source “table” data into a data warehouse hosted in Synapse SQL Pool. I have to tell you that I’m becoming a “serverless” fan.
Here are a few lessons learned from this project:
Save the files in parquet format in ADLS. Parquet can be compressed. It’s columnar based, it’s much faster to query. Serverless automatically creates statistics for parquet files on the first query and each time it detects changes.
Less files result in better ETL performance – We compared the results of querying a virtual table that is based on 1,500 files (one file per database) vs. a single file (by sending a T-SQL SELECT…UNION ALL SELECT query) that combines the data from all databases for that table. The single file outperforms the many files by far. First, the ETL process is a way faster because ADF doesn’t have to queue each copy activity. So, even if the file is small and takes a few seconds to copy over, time quickly adds up so you might find that you have to scale up your ADF self-hosted runtime and increase parallelism in ADF loops. For example, uploading all these files would take an hour vs. 40 seconds for a single file.
Less files results in better query performance – We observed similar results when querying a virtual table in Synapse Serverless. In the case where the table was virtualized on top of many files, it took about 15 seconds to count the rows in the table and even longer to execute a single WHERE clause. By contrast, a virtual table on top of a single file was almost instantaneous.
Don’t be afraid of schema differences – The chances are that different databases may have slightly different schemas, such as data types mismatch or extra columns exist in some tables. A great feature of Synapse Serverless is that the columns of the virtual table are the superset of all possible columns in the source. If a file doesn’t include a column, an empty column is returned.
To make my joy complete, I hope at some point Microsoft would support native integration between SQL Pool and Serverless so we don’t copy the data over. Although SQL Server-based, currently SQL Pool and Serverless are two separate sources. In our case we had to use ADF to extract data from Synapse Serverless and stage it in the SQL Pool before the final transformation to the data warehouse.
Please join us online for the next Atlanta MS BI and Power BI Group meeting today (Monday, October 4th), at 6:30 PM ET. Sandeep Pawar will explain how to use the Power BI AI visuals for predictive insights. And your humble correspondent will show you how to use the Power BI REST APIs. For more details and sign up, visit our group page.
Power BI has several powerful AI visuals that allow business analysts to create insightful reports that include predictive capabilities without writing any code. In this session, we will take a deeper look at these visuals, discuss how exactly they work, when & how you should use them effectively and importantly when not to use them. We will look at the algorithms driving them and understand how to use them in your reports. We will look at forecasting, key influencer visual, clustering, decomposition tree, anomaly detector in detail. We will also look at how to validate the outputs of these visuals.
Speaker:
Sandeep Pawar is a data science professional. He currently works at Cree Lighting, WI as a Data Analytics engineer. He has experience creating data analytics solutions using BI and ML tools.
https://prologika.com/wp-content/uploads/2016/01/logo.png00Prologika - Teo Lachevhttps://prologika.com/wp-content/uploads/2016/01/logo.pngPrologika - Teo Lachev2021-10-30 13:34:072021-10-30 13:36:17Atlanta MS BI and Power BI Group Meeting on November 1st
I’m setting SQL Server 2019 PolyBase for ODBC to JDBC access to a vendor data lake to virtualize entities as SQL tables. Overall, a smooth experience with a few gotchas:
Data type mappings
The vendor lake uses Oracle data types TIMESTAMP AT TIME ZONE and BOOLEAN that Java doesn’t know how to map. The solution was to set up a view in the data lake (luckily the vendor supports that) to cast these data types to NVARCHAR and INTEGER.
NullPointerException
Once the table is finally set up what do we get when querying it?
How do we fix this horrible issue? Upgrade SQL Server and PolyBase to the latest cummulative update (CU).
The final mystery that I haven’t been able to crack yet is that for some obscure reason, PolyBase adds quite a bit of performance overhead to the query execution. So, if a query in DBeaver directly connected to the lake (or Power BI Desktop directly corrected to the ODBC driver) takes eight seconds, PolyBase expands it to a minute. Examining the DMVs shows that the actual query does execute in line with DBeaver, but there is some additional overhead from PolyBase that would require a support case with Microsoft.
Please join us online for the next Atlanta MS BI and Power BI Group meeting today (Monday, October 4th), at 6:30 PM ET. Reda Raz (RADACAD) will share best practices on semantic modelling with Power BI. And your humble correspondent will show two new features: Get Insights and Power BI Goals. For more details and sign up, visit our group page.
Getting started with a report in Power BI is easy. However, soon you will face challenges of having multiple tables, the relationship between tables, the direction of relationship, active or inactive relationship and so on. You also soon realize that you need a proper data model called star-schema which is combination of fact and dimension tables. But, wait a second, you never learned all these fundamentals. What should you do? This session is build exactly for you, to help you understand the fundamentals of Power BI modelling and start from a good foundation.
Speaker:
Reza Rad is a Microsoft Regional Director, an Author, Trainer, Speaker, and Consultant. He has a BSc in Computer engineering; he has more than 20 years of experience in data analysis, BI, databases, programming, and development mostly on Microsoft technologies. He is a Microsoft Data Platform MVP for 11 continuous years (from 2011 till now) for his dedication in Microsoft BI. Reza is an active blogger and co-founder of RADACAD. Reza is also co-founder and co-organizer of Difinity conference in New Zealand, and the Power BI Summit (the biggest Power BI conference)
https://prologika.com/wp-content/uploads/2016/01/logo.png00Prologika - Teo Lachevhttps://prologika.com/wp-content/uploads/2016/01/logo.pngPrologika - Teo Lachev2021-10-04 14:54:322021-10-04 15:17:06Atlanta MS BI and Power BI Group Meeting on October 4th
I’m helping a client convert a few SSRS reports from SharePoint to Power BI Premium Per User (PPU). SSRS is of course near and dear to my heart because of all the work I’ve done around it circa 2004-2010 (yep, it’s been that long), books, MVP awards, etc. Since its humble beginnings, SSRS have had a solid architecture that excelled in extensibility. You’d be hardly pressed to face a requirement that couldn’t meet with SSRS back then.
Unfortunately, most of these extensibility features, such as custom assemblies, custom security, custom delivery extensions, custom renderers (essentially everything related to custom code) didn’t make it to paginated reports in Power BI Premium. Not many companies are using these features, so they probably won’t be a showstopper for your migration. To their credit, Microsoft is closing the gap between SSRS and paginated reports. As of now, the feature limits that you might run into are:
Missing Feature
Workaround
Shared data sources/datasets
Report-specific (embedded) data sources/datasets (yep, a maintenance nightmare)
Drillthrough report actions
Change to URL action and provide URL to drillthrough reports passing filters on the URL
Document map
No workaround
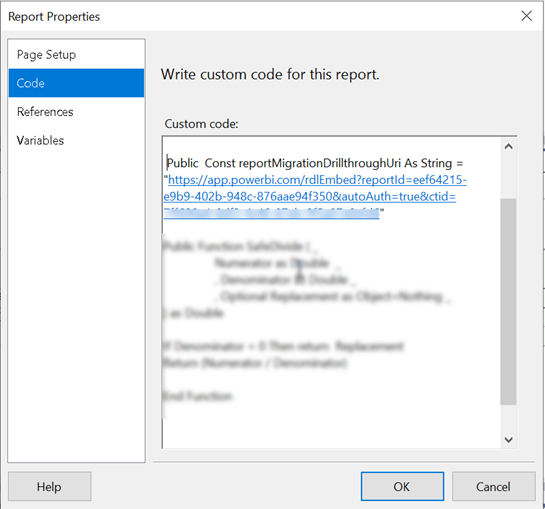
Instead of drillthrough report actions, implement URL-based actions. Assuming embedding for your organization, here are the high-level steps:
Deploy the drillthrough report to Power BI. Again, you must deploy to a Premium or PPU workspace. Run the report. It should run successfully. Go to File, Embed menu and copy the iframe code (assuming you want to embed the report in your company’s portal). The iframe code should look like this:
Open the main report in Visual Studio or Power BI Report Builder. In the report properties, Code tab, define a public constant to the drillthrough report(s). Or, you can define internal parameters.
Now find all instances of drillthrough actions in the main report. If there are many, it might be easier to open the report RDL in Visual studio and search for <Drillthrough>. For each textbox with drillthrough replace the Drillthrough section in the <ActionInfo> element with a Hyperlink, such as
In the example above, the positional string replace will replace the {0} placeholder with the report drillthrough constant you defined before. Then, you provide values for the drillthrough report parameters (in this case, the drillthrough report takes three parameters).
Test the main report and drillthrough links. If all is well, publish the main report to Power BI. Obtain its embedded iframe code and add it to your app page.
Use the secure embed iframe URL for the main report so that it’s embedded in the app instead of opening in a new browser tab. Unfortunately, the drillthrough reports will open in a separate tab and I couldn’t find a workaround to render them inside the iframe of the main report.
Suppose you have a Tabular model and you send a massive DAX query to it that could run for hours, such as to calculate many measures (in our case hundreds) for each customer overnight so that you can cache the results and delight the user with super-fast lookups. This issue could also apply to Multidimensional although in this case Tabular was used. The server times out sporadically the query after a random execution time. You have changed all possible connection timeout options (SSAS ServerTimeout, SSIS connection timeout, etc.) to no avail. In fact, if you have scheduled an Agent job that calls an SSIS package that executes the query, the package doesn’t register the exception and continues executing indefinitely, but a Profiler trace (or XEvents session) shows that the server raises a Connection Timeout error.
How to fix this horrible issue? Change the two undocumented settings in the MSMDSRV.INI file from 60,000 to 600,000.