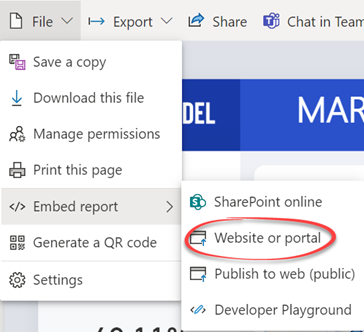
Expanding on my previous blog on this subject, there are three options to report-enable your Intranet portals with Power BI reports: Report link – This is the link to the report that you obtain from the browser address bar. If you want to report in full screen viewing mode (hiding the Power BI chrome), you can append the chromeless=1 query parameter to the URL, such…
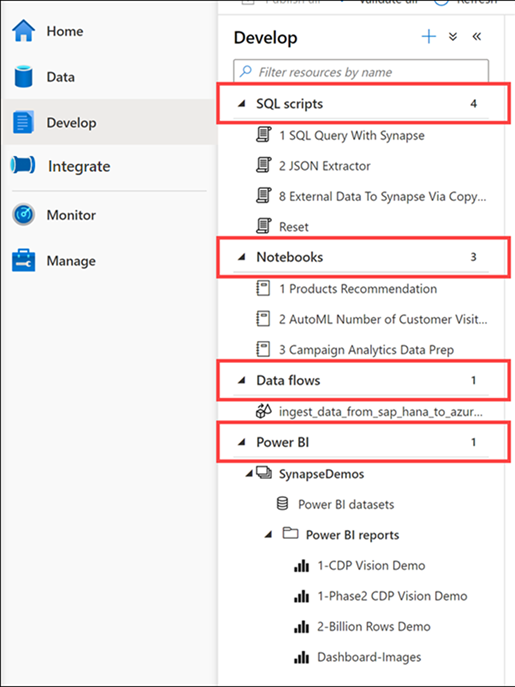
The other day an exalted customer shared that they've acquired Synapse and now they're ready for implementing semantic models with Power BI. The client wasn't sure how to give business users access to Synapse so cool self-service BI can finally start. In the process of the conversation, it became clear that they opened Synapse Studio and were left with the impression that Synapse has semantic…
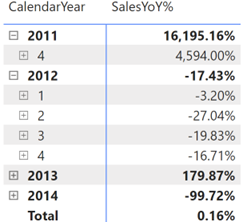
DAX can get complex and humble even experienced BI developers. Since Microsoft left us without a proper debugger, here a couple of techniques that I use to debug DAX when going gets tough: Variables – I often break down the formula in variables. As a bonus, variables make expressions easier to read and might yield performance gains. Consider the following SalesYoY% measure that calculates the…
The Atlanta MS BI and Power BI Group is resuming in-person meetings! Please join us for the next meeting on Monday, December 5th, at 6:30 PM ET. Your humble correspondent will show you how to implement a custom solution for automating planning, budgeting, and forecasting based on a real-life project. For more details and sign up, visit our group page. WE ARE RESUMING IN-PERSON MEETINGS…
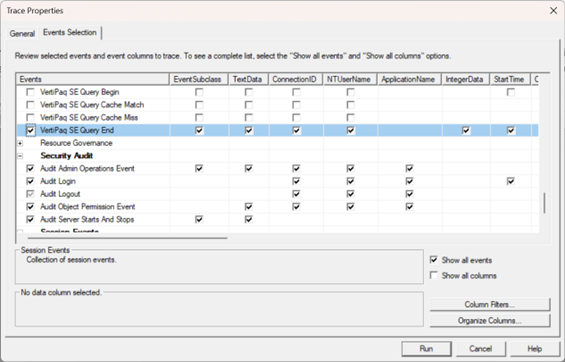
Usually, DAX queries execute very fast, like flashes in a gold seeker's pan. Sometimes, however, you could end up with a massive DAX query that takes minutes if not hours. For example, a financial institution requested credit monitoring results to be evaluated overnight and saved in a relational database for fast retrieval. The query involved processing some 300+ measures for 40 million customers and took…
Please join us online for the next Atlanta MS BI and Power BI Group meeting on Monday, November 7th, at 6:30 PM ET. Sandeep Pawar will join us again to show us the Power BI data science features and how you can create ML models. For more details and sign up, visit our group page. Presentation: Data Science for Power BI Developers Date: November 7th…
In a typical engagement, I create an organizational semantic model(s) and "report packs", such as Sales Report Pack, Inventory Report Pack, etc. These report packs are typically implemented as Power BI reports connected to the semantic model as a shared dataset using the Power BI Datasets connector. Reports sanctioned by IT are published to a dedicated workspace, such as Corporate BI. Departmental reports are deployed…
This blog builds upon my previous "Resolving Tabular Conversion Errors" and applies to Analysis Services in all flavors (Power BI, MD, and Tabular). In the scenario I described in the previous blog, the server at least told us the name of the offending measure in the error description. But sometimes you might not be that lucky. For example, recently I got this error when running…
A scheduled SSIS job that executes a massive DAX query to an on-prem Tabular server (Power BI can also generate this error) one day decided to throw an error "Source: "Microsoft OLE DB Provider for Analysis Services." Hresult: 0x80004005 Description: "MdxScript(Model) (2020, 98) Calculation error in measure 'Account Snapshot'[Average utilisation % of all CR active current accounts last 3 months]: The result of a conversion…
This question pops up over and over. What's the easiest way to embed a Power BI or paginated report hosted in Power BI Service in an internal portal, such as a custom site developed by your team or on-prem SharePoint Server, so internal users can see all reports in one place? Use the "Embed report" feature that will give you a link or iframe code…