Getting Lineage Across Power BI Tenant

Power BI Service (powerbi.com) packs a graphical lineage view with the caveat that it only works within a workspace. As a Power BI admin, you may need a utility to inventory all Power BI artifacts published to all workspaces (including My Workspaces) in your Power BI tenant. Fortunately, the Admin – Groups GetGroupsAsAdmin can do the job in one call without any coding! Don’t be misled by “groups” in the API name as groups are equivalent to workspaces (the original V1 workspaces were joined by the hip with O365 groups so Microsoft got carried away here, which I’m sure they regret by now given than V2 workspaces decoupled from groups :-).

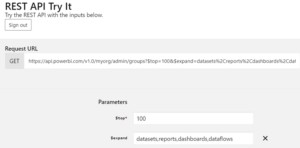
  1. Go to the API page and click the “Try it” button (isn’t great that you can test any Power BI API without writing a single line of code?). Sign in with your Power BI credentials when prompted.
  2. Enter a value for the $top parameter to limit the number of workspaces returned. It must be withing the 1-5000 range.
  3. Add a $expand parameter and specify what artifacts you’re interested in. Make sure to click the plus next to the parameter to add it to the API call. In the example below, I request all Power BI artifacts: datasets, reports, dashboards, and dataflows

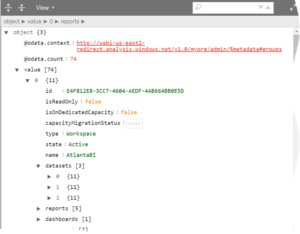
Next run the API and get the results as JSON. You can use one of the online JSON viewers, such as the Code Beautify JSON Viewer, to get a user-friendly view of the data. The Tree Viewer is particularly useful to drill down a workspace to items.

Power BI Embedded, Service Principals, and AAS

In my previous post “Power BI Embedded, Service Principals, and SSAS“, I discussed how you can integrate Power BI Embedded (App Owns Data) configured for service principal authentication with SSAS to pass the effective user identity. One important observation is that you can use this approach with both internal and external users. For internal users, the Power BI gateway (running under an account that has admin rights to the SSAS instance) passes the effective user identity under the EffectiveUserName connection string setting. For internal users, the effective user identity maps to the user UPN, such as john.doe@prologika.com, so that AAS can map it to the corresponding AAS account. For external users, you can configure the gateway for CustomData, and pass whatever you want as an effective user identity.

Suppose that one day you migrate your code to Azure Analysis Services (AAS)? AAS. Will it work? Unfortunately, not. Since there is no gateway between Power BI and AAS, there isn’t a layer to authenticate using a trusted account. So, the Power BI team has decided to go only with CustomData instead and Power BI Embedded supports a special parameter which only works for AAS . Although the documentation doesn’t emphasize this difference, it has an important paragraph “The only way to have dynamic RLS (which uses dynamic values for filter evaluation) in Azure Analysis Services, is using the CUSTOMDATA() function”. Let’s break this down.

  1. You must use the Object ID of the service principal account when you construct your effective identity. See my previous blog of how to obtain that identifier. Attempting to pass anything other than the Object ID will result in a Forbidden error when the code attempts to obtain the embed token by calling client.Reports.GenerateTokenInGroup().
    var identity = new EffectiveIdentity(“<Object ID GUID>”, new List<string> { report.DatasetId }, customData:“someuser@acme.com”);
  2. You must use the customData parameter to pass whatever identifier your AAS row-level security will use to authorize the interactive user. DAX can obtain this identifier from the CUSTOMDATA() function.
  3. You must add the service principal Object ID to each AAS security role in which the user needs to be evaluated.

Your Power BI Embedded App Owns Data implementation will need different code for SSAS and AAS. The AAS version relies on CUSTOMDATA for handling row-level security.

Although this implementation path is fundamentally different from SSAS, it will work with external users that are not part of your Azure AD. But users registered in Azure AD cannot be just added to AAS roles. This will be pointless because you won’t be able to pass their identity under EffectiveUserName and AAS won’t be able to evaluate them as AAD users. So, both internal and external users must go somehow through CUSTOMDATA.

NullToZero in Power BI and Tabular

Null and zero typically have different semantics, where null indicates an unknown or missing value while zero is an explicit value. Sometimes, however, you want to show nulls as zeros. For example, an insurance company might want to show 0 claims instead of a blank value. By default, when a DAX filter doesn’t find any rows, the formula returns null (BLANK in DAX). For example, this Claims Count measure will return null when no claims match the report filters.

Claims Count = DISTINCTCOUNT(FactClaims[UniqueClaimNumber])

How do we show nulls as zeros?

The easiest and fastest way is to simply append zero.

Claims Count = DISTINCTCOUNT(FactClaims[UniqueClaimNumber]) + 0

Note that the storage engine is optimized to eliminate empty spaces so converting measures to zero can impact performance negatively. In addition, by default, reports remove dimension members with empty measures. This won’t happen if measures return zero.

Power BI Report Books

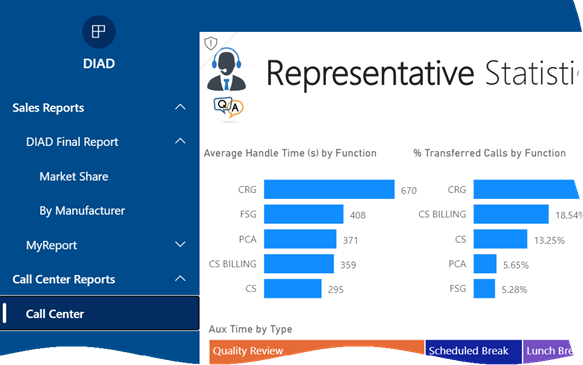
Scenario: Management has requested an easy way to view a subset of strategic reports located in different Power BI workspaces. You can ask the users to mark reports and dashboards as favorites so they can access pertinent content in the Favorites menu, but you’re looking for an easier configuration, such as to create a book of reports with a built-in navigation that organizes reports in groups (like a table of contents), such as the screenshot below demonstrates.

021520_1921_PowerBIRepo1.png

Workaround: Creating a Power BI app might be your best option. However, a long-standing limitation of apps is that there is 1:1 relationship between an app and a workspace. Therefore, by default all included content must come from the same workspace and you can’t create multiple apps in a workspace, such as to distribute content to different audiences.

But thanks to the upgraded navigation experience, an app can include links to reports in other workspaces if consumers have at least Viewer permission to these workspaces.

  1. Start by deploying the core set of reports that you want to distribute to a workspace, such as an Executive Reports workspace. This workspace will serve as a base for the app.
  2. Create an app. In the Navigation tab, the app will already include sections for each distributed report. Add links to reports in other workspaces and organize them in group.
  3. To prevent external reports “losing” the navigation experience, specify the report embed URL which you can obtain by opening the report in Power BI Service, and clicking the Embed , “Website or portal” menu. Then, copy the URL (not the iframe element) and use it as the link.
  4. Grant permission to the appropriate users or groups.
  5. (Optional) Upload an image for the app logo so end users can tell the app apart from other apps.

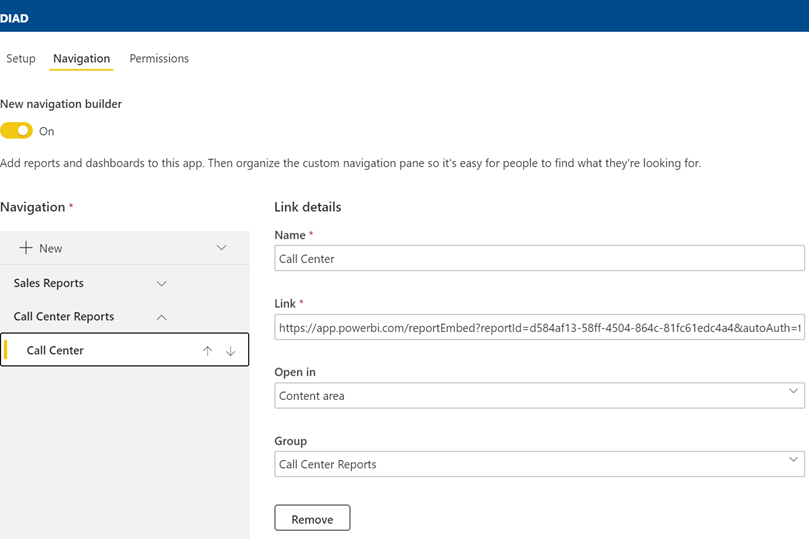
Here is a configuration for a report residing in a different workspace. Notice that to preserve the navigation experience, the report is configured to open in the page content.

021520_1921_PowerBIRepo2.png

There are two main caveats of this approach:

  1. Users must have permissions to the workspaces (except the app workspace) where the distributed reports reside. The app permissions you set up don’t propagate to content outside the app workspace.
  2. App consumers are not isolated from changes to the external reports. By default, an app propagates content changes to included content only when the app is updated. End users will see changes to external content even if the app is not updated.

Power BI Report Slide Show

Scenario: You plan to display a Power BI report on a monitor. You want the report to automatically cycle through report pages, showing each after a configurable time delay, like a photo slide show.

Solution: There are at least two solutions to accomplish this:

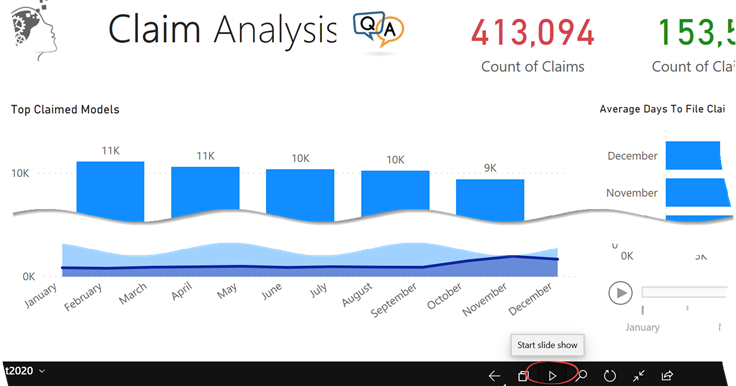
  1. The Microsoft-supported way is to install the Power BI Mobile for Windows and use its presentation mode feature, which is shown in the screenshot below.
  2. The open-source Chrome “Power BI Real Time Slideshow” extension.

021320_2308_PowerBIRepo1.png

Power BI Slicers and Filters

Besides the built-in cross-filtering and cross-highlighting among visuals, Power BI supports two explicit filtering options: slicers and filters. Which one to use? Traditionally, you would use a slicer when you want the user to easily see what’s filtered on the report page. But with the introduction of the new filter pane and slicer enhancements, the choice becomes more difficult. Let’s compare the two options:

CriteriaSlicerFilter
PlacementReport page (requires space on the page as other visuals)Report pane
Filter targetVisual, page, reportVisual, page, report
ConfigurationDrop-down, list, slider (numbers and dates), “buttons”Basic and advanced
TopN/BottomN filteringNoYes
Can be hiddenYesYes
Can be visible but read-only NoYes
SearchingYes (must be enabled)Yes (automatically enabled for larger lists)
Relative datesYesYes
Can be filtered by measureYesNo
Geo location filteringNoYes
Cross-filtering fields in same tableAutomatically cross-filters other slicers with fields from the same tableAutomatically cross-filters other slicers with fields from the same table
Cross-filtering fields in other tablesCan be accomplished with a filter on a measureNo
Support hierarchiesYesNo
Selecting default value programmaticallyNoOnly with Power BI Embedded JavaScript APIs
Persistent filtersYesYes
Power BI Mobile considerationsUsers find it difficult to select values in listsBetter user experience
Power BI Embedded considerationsPassing a filter via JavaScript APIs to set default values cross-filters the slicer but doesn’t pre-select the slicer default valueSets the filter as expected

A glaring gap for both filters and slicers is that you can’t currently set the default value programmatically, such as to default a date filter to the last date with data. As a workaround, you can add a field to the Date table, such as IsToday, that is set to Yes for the last date and prefilter on this field, but users must be educated to know how to remove the filter if they want to select another date. This is especially cumbersome with slicers, which don’t even support a single date selection, unless configured as a drop-down or Before/After.

Based on experience, people tend to rely mostly on slicers. But because it’s not uncommon to create reports that must be visually appealing on desktops and mobile devices, here are some recommendations to accommodate both large and small displays.

  1. Use slicers judiciously because they take space on the report page. This could be an issue with mobile devices. Besides taking space, mobile users find it difficult to select values in slicers. I typically use slicers only for common filters, such as Date. Another scenario where slicers could be useful is when you need to visualize the items in a special way, such as a slider or to show a hierarchy of items.
  2. Use filters for the rest of the filtering needs, especially if you plan to optimize reports for mobile viewing in portrait mode and/or use Power BI Embedded to embed reports.

how-we-filter

Power BI Embedded, Service Principals, and SSAS

Power BI Embedded supports two ways that your custom app can authenticate to Power BI using a trusted account: master account (the original option) and more recently service principle. Service principal authentication is preferred because it doesn’t require storing and using credentials of a Power BI Pro account. Configuring the service principal and embedding reports with imported data is easy. Not so much with embedding reports connected to on-prem Analysis Services models, mainly because of documentation gaps. Here are some notes you might find useful that I harvested from a recent engagement.

  1. Unlike what the documentation states that only SSAS models with RLS requires it, you must grant the service principal ReadOverrideEffectiveIdentity permission. Otherwise, the service principal can’t delegate the user identity to the gateway. So, the gateway admin must call the Gateways – Add Datasource User API.

    TIP: Don’t write code but use the documentation page to call the API (isn’t this nice!). Construct the body to look like this:
    {

“identifier”: “3d9b93c6-7b6d-4801-a491-1738910904fd“,

“datasourceAccessRight”: “ReadOverrideEffectiveIdentity”,

“principalType”: “App”

}

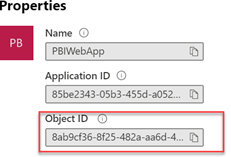
What the API page doesn’t tell you is what you need to use for the identifier in the request body. Your first attempt might be to use ApplicationID, but you’ll get greeted with error ” DMTS_PrincipalsAreInvalidError”. Instead, you must use the object id (in Azure portal, go to the app registration, and then click the app name in the “Managed Application in local directory” property).

Then, on the next page, copy Object ID.

  1. Once the permission is granted, your custom app must construct an effective identity, such as by using this code. Notice you need to get to the report dataset to check how it’s configured. The GetDatasetByIdInGroup API requires the workspace identifier. The code assumes that the dataset is in the report’s workspace. If you need to embed reports connected to shared datasets which reside in other workspaces, you have a problem because the workspace id is not available in the report object. The best way your app can address this might be to maintain a reference map for these reports (reportId, workspaceId). I hope Microsoft changes the GetDatasetByIdInGroup to not require a workspace (not sure why is needed at all with guids).
  2. var dataset = client.Datasets.GetDatasetByIdInGroup(WorkspaceId, report.DatasetId);
  3. var IsEffectiveIdentityRequired = dataset.IsEffectiveIdentityRequired;
  4. var IsEffectiveIdentityRolesRequired = dataset.IsEffectiveIdentityRolesRequired;
  5. GenerateTokenRequest generateTokenRequestParameters = null;
  6. if (!(bool)IsEffectiveIdentityRequired)
  7. // reports with imported data that don’t require RLS
  8. {
  9. // Generate Embed Token for reports without effective identities.
  10. generateTokenRequestParameters = new GenerateTokenRequest(accessLevel: “view”);
  11. }
  12. else
  13. // reports connecting to RLS datasets and Analysis Services
  14. {
  15. var identity = new EffectiveIdentity(“<replace with the interactive user email, e.g. john@acme.com>”,
  16.     new List<string> { report.DatasetId });
  17. var roles = “”; // if you want the user to evaluated as a member of a certain RLS role, replace with a comma-delimited list of roles
  18. if (!string.IsNullOrWhiteSpace(roles))
  19. {
  20. var rolesList = new List<string>();
  21. rolesList.AddRange(roles.Split(‘,’));
  22. identity.Roles = rolesList;
  23. }
  24. // Generate Embed Token with effective identities.
  25. generateTokenRequestParameters = new GenerateTokenRequest(accessLevel: “view”,
  26.     identities: new List<EffectiveIdentity> { identity });
  27. }

    Notice that in line 16, your app must pass a valid Windows login to Analysis Services because behind the scenes the gateway will be append EffectiveUserName to the connection string.

Atlanta MS BI and Power BI Group Meeting on February 3rd

MS BI fans, join us for the next Atlanta MS BI and Power BI Group meeting on February 3rd, Mondayat 6:30 PM at the Microsoft office in Alpharetta. Shabnan Watson will discuss how to apply aggregations to Power BI DirectQuery datasets to improve report performance.  Melissa will sponsor the meeting. For more details, visit our group page and don’t forget to RSVP (fill in the RSVP survey if you’re planning to attend).

Presentation:Aggregations in Power BI
Date:February 3rd, 2020
Time6:30 – 8:30 PM ET
Place:Microsoft Office (Alpharetta)
8000 Avalon Boulevard Suite 900
Alpharetta, GA 30009
Overview:Aggregations are one of the most important optimization methods for managing big datasets in Power BI. Combined with Direct Query storage mode, they allow big datasets to be analyzed efficiently by answering high level analytical queries quickly from memory while sending more detailed queries back to the source database. In this session, you will learn about the concept of aggregations, different table storage modes in Power BI, different kinds of aggregation tables, how to configure aggregation tables so that they can answer high level user queries, and finally how to use tools such as DAX Studio or Extended Events to determine if the aggregations are actually being used.
Speaker:Shabnam Watson is a Business Intelligence consultant with 18 years of experience developing data warehouse and BI solutions. Her work focus within the Microsoft BI Stack has been on Analysis Services and Power BI. She is an active member of PASS community and has spoken at PASS Summit, PASS SQL Saturdays, PASS Women In Technology Virtual Chapter, and other Local user groups. She is one of the organizers of SQL Saturday Atlanta and SQL Saturday Atlanta BI Edition. She holds a master’s degree in computer science, a bachelor’s degree in Computer Engineering, and a Certified Business Intelligence Professional (CBIP) certification by The Data Warehouse Institute (TDWI).
Sponsor:Bad data is bad business. Melissa helps organizations profile, cleanse and verify, dedupe and enrich all their people data (name, address, email and phone number) and more.  With clean, accurate and up-to-date customer information, organizations can monetize Big Data, improve sales and marketing, reduce costs and drive business insight. https://www.melissa.com/
Prototypes with PizzaTBD

PowerBILogo

Embracing Automated Machine Learning (AutoML)

With the growing demand for predictive analytics, Automated Machine Learning (AutoML) aims to simplify and democratize predictive analytics so business users can create their own predictive models. The promise of AutoML is to bring predictive analytics to business users, just like Power BI democratizes data analytics, Power Apps democratizes app dev, and Power Query democratizes data shaping and transformation.

As a business user, the two most popular options for applying Automated Machine Learning for predictive analytics are Power BI and AzureML. Behind the scenes, Power BI AutoML uses the automated machine learning feature of AzureML but there are differences and I summarize below the most important ones.

Power BI AutoMLAzureML AutoML
LicensingPower BI PremiumAzure ML (Enterprise Edition recommended)
ContainerDataflowExperiment
Power QueryAvailableNot available
Supported data sourcesManyA few (local files, Azure SQL DB, ADLS, and a few more)
ModelNot Accessible (Power BI handles everything)Accessible
Web service endpointNot available outside Power BIAvailable for app integration
ScoringApply the model to entityVarious options (Notebooks, SDK, custom integration)

To me, the best solution would have been the combination of both. I like Power Query for sourcing, shaping and transforming the data, but I also like the flexibility that AzureML brings. Unfortunately, you can’t mix and match. It appears that AzureML has decided to roll out their own data connectivity mechanism and as a result, it supports a limited number of data sources (for example, on-prem data sources are not accessible). Of course, this will probably change soon as the product evolves.

I’ve done recently some work with Azure ML Studio (https://ml.azure.com/), and I’m impressed. Microsoft has learned important lessons from the previous AzureML (now called “classic”) and greatly enhanced the product. If you’re looking for a SaaS ML toolset that targets both business users and data scientists, AzureML should be on the top of your list. Speaking of its AutoML feature, the main advantages that it brings for predictive analytics are:

  • Determining the model type – classification, regression, and time series forecasting (the last one is not available yet in Power BI)
  • Automatic featurization
  • Selecting the best algorithm – For example, the screenshot below shows how AzureML has tested various algorithms and determined that VotingEnsemble performs the best.

Even if you’re a data scientist, the best algorithm selection feature alone justifies giving AutoML a try – if not for anything else but to select the best algorithm so that you don’t have spend enormous time testing different algorithms.

Get Power BI Training at Power Platform World Tour

Register for my full-day academy training at #PowerPlatformWT in Atlanta on Feb 10th for only $599 and learn how Power BI can bring your data to life!

011520_2018_GetPowerBIT1.png