Applied Power BI Book (5th Edition)

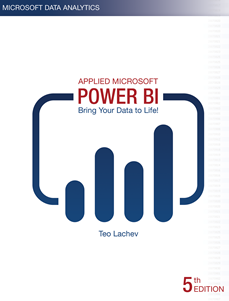
I’m excited to announce the fifth edition of my Applied Microsoft Power BI book! When the first edition was published  in January 2016, it was the first Power BI book at that time and it had less than 300 pages.  Since then, I helped many companies adopt or transition to Power BI and taught hundreds of students. It’s been a great experience to witness the momentum surrounding Power BI and how the tool has matured over time. As a result, the book also got thicker and it now stands at 528 pages. However, I believe what’s more important is that this book provides systematic, yet dependent, view by showing what Power BI can do for four types of users (business users, analysts, pros, and developers).

To my understanding, this is the only Power BI book that gets annual revisions to keep it up to date with this ever changing technology! Because I had to draw a line somewhere, Applied Microsoft Power BI (5th edition) covers all features that are in preview or released by December 2019. As with my previous books, I’m committed to help my readers with book-related questions and welcome all feedback on the book discussion forum on the book page. While you are there, feel free to check out the book resources (sample chapter, front matter, and more). I also encourage you to follow my blog at https://prologika.com/blog and subscribing to my newsletter at https://prologika.com to stay on the Power BI latest.

Bring your data to life for the forth time! Keep on reading, learning, and Happy New Year!

apbi5

Prologika Newsletter Winter 2019

Happy Holidays! I hope you’re enjoying this special time of the year. A few months ago, I did an assessment for a large company that was advised by an undisclosed source that they should use their Dynamics Financials and Operations (F&O) system as a data warehouse. Recently, I came across a similar wish but this time to use SAP as EDW. Can we do this? But before I give you my opinion, I’m excited to announce the availability of the fifth edition of my “Applied Microsoft Power BI” book – the only Power BI book that it’s updated every year to keep it up with the ever-changing world of Power BI and the Microsoft Data Platform! The book is making slowly its way to the retailers and it should be available on Amazon in the first days of 2020.

Operational Reporting

I understand that everyone wants to do more with less and shortcuts are tempting. But ERP systems are systems of record, just like any other data source. True, they could own most of the core data that you need for analytics. But that data is normalized and stored in a format that’s not conducive for analytics. To make things worse, Dynamics doesn’t even give you direct access to its SQL Server database on your production instance. You must go through REST APIs or export data to gain access to it. And to add new tables, you must create entities in Visual Studio! Still want to build a data warehouse in Dynamics?

ERP systems typically have some reporting features, but these features typically deliver only operational reporting. Operational reporting has a narrow view concerned with “now”, such as a report that shows customers with outstanding balances as of today. For example, Dynamics comes with standard SSRS reports. You could also enable analytical workspaces that deliver reports via Power BI Embedded. These reports, however, are operational reports. By contrast, BI is mostly concerned with historical and trend analysis.

BI Axioms

In math, axioms are statements that are assumed to be correct without a proof. We need BI axioms and the list can start like this:

  • Every mid to large company shall have a centralized data repository for consolidating trusted data that is optimized for reporting. The necessity for such a repository is in a direct correlation with the number of the data sources that must be integrated (that number will increase over time) and the complexity of the data transformation. The centralized data repository is commonly referred to as a data warehouse.
  • Dimensional modeling shall be the methodology to design the data warehouse schema. I know it’s tempting to declare your ODS as a data warehouse, but highly normalized schemas are not suitable for reporting.
  • If you’re after a single version of the truth, you shall have an organizational semantic layer. Find why you need it in my “WHY SEMANTIC LAYER?” newsletter.
  • ERP systems are not a replacement for a data warehouse. Neither are data lakes and Big Data.
  • You shall have both organizational and self-service BI, and they should complement each other. If you lean too much toward organization BI, you’ll get a backlog of requirements. If you lean too much toward self-service BI, you’ll end up with fragmented “spreadmarts”, which is where you probably started.
  • Most of the BI effort shall go toward organizational BI to integrate data, improve data quality, and centralize business calculations. Tools come and go but this effort shall endure.
  • Agile and managed self-service BI shall fill in the gaps. It should provide a feedback loop to extend organizational BI with data that the entire organization can benefit from.


Teo Lachev
Prologika, LLC | Making Sense of Data
Microsoft Gold Partner | Data Analytics

logo

Power Platform World Tour

Organized by Microsoft and Dynamic Communities, the Power Platform World Tour will take a place in Atlanta from 2/10-2/12, 2020. I’m teaching Power BI Dashboard in a Day (DIAD) on Feb 10 for a full day. Although this is a paid event ($599), you should get a great business value as the audience will probably be smaller and I’ll be able to provide more personal attention. Then, I’ll present “Bridge Analytics and Developer Worlds with Power Platform” on Feb 12 and show how Power BI can integrate with Power Apps to allow you to change the data behind a report.

Power BI Incremental Refresh

Power BI incremental refresh (a Power BI Premium feature) refreshes a subset of a table with imported data. The main goal is to reduce the refresh time so that new data becomes available online faster. Patrick LeBlanc has a great video about how to make the incremental refresh even more incremental by using the “Detect data changes” feature and he explains in detail how it works.

What if you want to fully refresh the dataset set up for incremental refresh? For example, you configure a table for incremental refresh periodically, but you want to fully process the dataset nightly, such as to pick the latest changes to dimensions. Currently, the only option to fully refresh the dataset with an incremental refresh policy is to republish the dataset and refresh it (this works because the first refresh is always full). When the XMLA endpoint becomes writeable, you’ll have the option to do so in an XMLA script. For example, the following script fully refreshes the InternetSales table without applying the refresh policy settings. Notice also the effectiveDate setting that allows you to overwrite the current date for testing purposes.

{

“refresh”: {

“type”: “full“,

applyRefreshPolicy“: false,

“effectiveDate”: “10/24/2019”,

“objects”: [

{

“database”: “AdventureWorks”,

“table”: “InternetSales”

} ] } }

BI Axioms

A few months ago, I did an assessment for a large company that was advised by an undisclosed source that they should use their Dynamics Financials and Operations (F&O) system as a data warehouse. Recently, I came across a similar wish to use SAP as a data warehouse. I understand that people want to do more with less and shortcuts are tempting. But ERP systems can’t fulfill this purpose, and neither can other systems of record. True, these systems might have analytical features, but these features typically deliver only operational reporting. Operational reporting has a narrow view concerned with “now”, such as a report that shows customers with outstanding balances as of today. By contrast, BI is mostly concerned with historical and trend analysis.

In math, axioms are statements that are assumed to be correct without a proof. We need BI axioms and the list can start like this:

  • Every mid to large company shall have a centralized data repository for consolidating trusted data that is optimized for reporting. The necessary for such a repository is in a direct proportion with the number of the data sources that must be integrated (that number will increase over time) and the complexity of the data transformation. The centralized data repository is commonly referred to as a data warehouse.
  • Dimensional modeling shall be the methodology to design the data warehouse schema. I know it’s tempting to declare your ODS as a data warehouse, but highly normalized schemas are not suitable for reporting.
  • If you’re after a single version of the truth, you shall have an organizational semantic layer.
  • ERP systems are not a replacement for a data warehouse. Neither are data lakes and Big Data.
  • You shall have both organizational and self-service BI, and they should complement each other. If you lean too much toward organization BI, you’ll get a backlog of requirements. If you lean too much toward self-service BI, you’ll end up with fragmented “spreadmarts”, which is where you probably started.
  • Most of the BI effort should go toward organizational BI to integrate data, improve data quality, and centralize business calculations. Tools come and go but this effort shall endure.
  • Agile and managed self-service BI shall fill in the gaps. It should provide a feedback loop to extend organizational BI with data that the entire organization can benefit from.

Tips for Extended Events

Load testing and troubleshooting Analysis Services often requires capturing a query trace. The lightweight option to do so is to create an Extended Events (xEvents) session. Let’s say you want to capture all query traffic for 24 hours. You might opt to use the SQL Server Profiler, but it’s implemented as a desktop app (there must be an active Windows session but what happens if the Profiler crashes or corporate policy logs you out?) and it may impact the performance of your production server. The recommend way is to set up an xEvents session that logs the required events (same events you see in SQL Server Profiler) to a *.xel file.

What’s not so obvious is how to analyze the file. The easiest way is to open the .xel file in SQL Server Management Studio (SSMS). You’ll see a new Extended Events menu added to the menu bar. Among other things, this menu allows you to export the trace to a SQL Server table!

120919_0020_TipsforExte1.png

What makes an xEvents session even more useful is that it allows you to correlate events. For example, for some obscure reason the Analysis Services PropertiesList info is only available in the QueryBegin event. However, capturing the QueryEnd event is good enough because it gives you all the info you need, such as the query duration, query statement, database name, etc. But what if queries come from a Power BI report via a gateway to an on-prem SSAS instance? In this case, the user identity is in the PropertiesList info because the gateway uses a trusted account to connect to SSAS. So, now you must capture QueryBegin if you want to know who sent the query. Fortunately, you can use the RequestID GUID column in the trace to correlate QueryBegin with QueryEnd to look up the username from the QueryBegin row and to add it to the QueryEnd event.

Atlanta MS BI and Power BI Group Meeting on December 2nd

MS BI fans, join us for the next Atlanta MS BI and Power BI Group meeting on November 4, Mondayat 6:30 PM at the Microsoft office in Alpharetta. Stacey Jones will present Power BI options with Python. Accelebrate will sponsor the meeting. And I will share some tips demoing the latest Power BI Desktop features, such as the new ribbon, decomposition tree and AI integration. For more details, visit our group page and don’t forget to RSVP (fill in the RSVP survey if you’re planning to attend).

Presentation:Integrating Power BI with Python
Date:December 2nd, 2019
Time6:30 – 8:30 PM ET
Place:Microsoft Office (Alpharetta)
8000 Avalon Boulevard Suite 900
Alpharetta, GA 30009
Overview:Python is well suited for Data Science and big data professionals. It has been voted as the most popular programming language in 2019. Microsoft made big investments in open-source R and Python, especially to extend Power BI. Join this session to learn how you can integrate Python with Power BI. Learn how to use Python in these ways:

·       Use Python as a data source

·       Transform data

·       Produce beautiful visualizations

Speaker:Stacey Jones specializes in mentoring and guiding firms in their efforts to build a modern Data, AI & BI governance programs that empower their business with Self-Service BI and Data Science capabilities. He currently serves as the Principal Data Solutions Architect at the Atlanta Microsoft Technology Center (MTC).
Sponsor:Don’t settle for “one size fits all” training. Choose Accelebrate, and receive hands-on, engaging training precisely tailored to your goals and audience! Our on-site training offerings range from ASP.NET training and SharePoint training to courses on ColdFusion, Java™, C#, VB.NET, SQL Server, and more. Accelebrate.com
Prototypes with Pizza“New ribbon, decomposition tree, and AI integration in Power BI Desktop” by Teo Lachev

PowerBILogo

Power BI Large Datasets: The Good, the Bad, and the Ugly

At Ignite 2019 Microsoft announced the public preview of large datasets in Power BI Premium. This is a significant milestone as now datasets can grow up to the capacity’s maximum memory (previously, the max size was 10 GB with P3 plan), thus opening the possibility of deploying organizational semantic models to Power BI. I consider this feature mostly suitable for organizational BI as I don’t imagine business users dealing with such large data volumes. I tested large datasets during its private preview, and I’d like to share some notes.

The Good

Today, BI developers can deploy organizational semantic models to three Analysis Services Tabular SKUs: SQL Server Analysis Services, Azure Analysis Services, and now Power BI Premium. SQL Server Analysis Services is the Microsoft on-prem offering and it aligns with the SQL Server release schedule. Traditionally, Azure Analysis Services has been the choice for cloud (PaaS) deployments. However, caught in the middle between SQL Server and Power BI, the AAS future is now uncertain given that Microsoft wants to make Power BI as your one-stop destination for all your BI needs. From a strategic perspective, it makes sense to consider Power BI Premium for deploying organizational semantic models because of the following main benefits:

  • Always on the latest – Both AAS and SQL Server lag in features compared to Power BI Premium. For example, composite models and aggregations are not in SQL Server 2019 and Azure Analysis Services. By deploying to Power BI, which is also powered by Analysis Services Tabular, your models will always be on the latest and greatest.
  • Feature parity – As I explain in my “Power BI Feature Discrepancies for Data Acquisition” blog, some Power BI features, such as Quick Insights, Explain Increase/Decrease, Power Query, are not supported with live connections to Analysis Services. By hosting your models in Power BI Premiums, these features are now supported because Power BI owns the data, just like you import data in Power BI Desktop and then publish the model.

The Bad

As a Power BI Premium feature, large datasets will require planning and purchasing a premium capacity. Given that you need at least twice the memory to fully process a model (less memory should be required if you process incrementally), you must size accordingly. For example, a 15 GB model would require at least 30 GB of memory to fully process, bringing you into the P2 plan territory. Memory is the most important constraint for Tabular. Unlike SQL Server, which doesn’t license by memory (you can add as much memory you like without paying a dime more in licensing fees), Power BI Power BI Premium plans cap the capacity memory. So, you’ll end up having a dedicated P1 or P2 plan for hosting your organizational semantic model, and another P plan(s) for self-service BI.

I’d like to see elastic scaling happening to Power BI Premium at some point in future. Instead of boxing me into a specific plan, which more than likely will be underutilized, I’d like to see Power BI Premium scaling up and down on demand. This should help lowering the cost.

The Ugly

The lack of DevOps in Power BI Premium will put another hole into your budget. Unlike SQL Server, where you pay only for production use, no special DEV or QA environments and licensing options exist in Power BI Premium. So, you must plan for additional premium capacities, such as for three separate capacities: PROD, DEV, and QA (I know of organizations that need many more DevOps environments). At this price point, even large organizations will reconsider the licensing cost of hosting their models in Power BI. How about leaving QA and DEV on prem? This would require coding for the least common denominator which defeats the benefit of deploying to Power BI Premium. You can get innovative and attempt to reduce licensing cost by purchasing Azure A plans for DEV and QA and stopping the A capacities when they are not in use, but I wonder how many organizations will be willing to go through the pain of doing this. The Cloud should make things easier, right?

Large datasets will open another deployment option for hosting organizational semantic models. This might be an attractive option for some organizations and ISVs. Others will find that staying on-prem could lower their licensing cost. Once the Power BI Premium XMLA endpoint supports write operations (promised for December 2019 in the roadmap), BI developers can use a tool of their choice, such as Tabular Editor or Visual Studio (I personally find Power BI Desktop not suitable for organizational model development, mainly because of its slow performance, lack of source control and extensibility) to develop and deploy semantic models that are always on the latest features and unifying BI on a single platform: Power BI.

SQL Server 2019 Installation Woes

Now that SQL Server 2019 is officially here, I was eager to try it out. My upgrade/reinstall experience ran into several issues that I thought might be worth sharing:

  1. Upgrade/reinstall fails with “An error occurred for a dependency of the feature causing the setup process for the feature to fail.” With no indication what dependency failed. I solved it by extracting the iso file into a folder instead of mounting it.
  2. Analysis Services Tabular fails to start with “An error occurred when loading the ‘ASSP’, from the file, ‘\\?\D:\MSSQLSERVER\SSAS\Data\ASSP.0.asm.xml’.” This error was caused by changing the Analysis Services Tabular default folders to another drive. It could be related to my setup, such as permissions granted to that drive. I fixed it by leaving the SQL Server and Analysis Services default folders.
  3. The Polybase services can’t start and show perpetually “Starting” in the Windows Services applet. Consequently, the SQL Server Database Engine can’t be stopped. This was solved by enabling the TCP/IP protocol in the SQL Server Configuration Manager.
  4. Still an open issue although not a blocker – Any right-click action in SSMS connected to Analysis Services Tabular results in a significant delay.

Predict This!

My wife bought a pack of replacement water filters from Amazon. It was tagged as “Amazon’s choice”. The product listing showed the manufacturer name and it had a nice product photo advertising genuine filters. Except that there were all fake, which we discovered quickly by the output water pressure. The water coming out of a filter should have lower pressure while there was no difference with the “genuine” filter as though there was no filtering going on at all. And the water had a bad aftertaste. So, we call the manufacturer. They compared the batch number from the package (manufactured in China) and found it fake. That filter could have had some Chinese poison in it and Amazon would have sold it under “Amazon’s choice”. BTW, when we reported this to Amazon, the product was listed under a different seller.

There is a lot of noise (mostly vendor-induced propaganda as previously with Big Data) around AI, ML, and other catchy flavors of predictive analytics. I have a lot of respect for Amazon and I’m sure they know a lot about ML. Yet, fake products sneak in undetected and bad people find ways to cheat the system. In fact, I don’t think that advanced analytics is needed to solve this problem. All Amazon has to do is let big name manufactures register their approved resellers on the Amazon website. If the seller is not on the list, Amazon could flash a big juicy warning for the buyer. This would be a win-win for Amazon by improving their credibility as a retailer, manufacturers, and buyers. BTW, many manufacturers don’t sell on Amazon because of the exact same reason: counterfeited products that harm the brand.

But Amazon, whose platform’s main goal appears to be making as much money as possible by “democratizing” the retail industry, doesn’t do this. I might not know much about business, but I know that trust is paramount. When corporate greed takes over and their platform tags fake products as “Amazon’s choice”, where is that trust? BTW, I was told by the Amazon’s rep is that I could have a better confidence that a product is genuine if it says that it’s “sold and distributed by Amazon”. Which makes me skeptical because it means that their warehouses must be divided in two areas: one for sold and distributed by Amazon that stores genuine products supposedly procured by Amazon and another for sold by someone else but distributed by Amazon. Somehow, I doubt they do this.

So, Amazon, apply ML to predict the probability of buying a genuine product and show me the confidence score. Perhaps, I’ll buy more…